Chickasaw Married-Couple Family Poverty
COMPARE
Chickasaw
Select to Compare
Married-Couple Family Poverty
Chickasaw Married-Couple Family Poverty
5.8%
POVERTY | MARRIED-COUPLE FAMILIES
2.3/ 100
METRIC RATING
244th/ 347
METRIC RANK
Chickasaw Married-Couple Family Poverty Correlation Chart
The statistical analysis conducted on geographies consisting of 147,342,221 people shows a slight positive correlation between the proportion of Chickasaw and poverty level among married-couple families in the United States with a correlation coefficient (R) of 0.056 and weighted average of 5.8%. On average, for every 1% (one percent) increase in Chickasaw within a typical geography, there is an increase of 0.033% in poverty level among married-couple families.
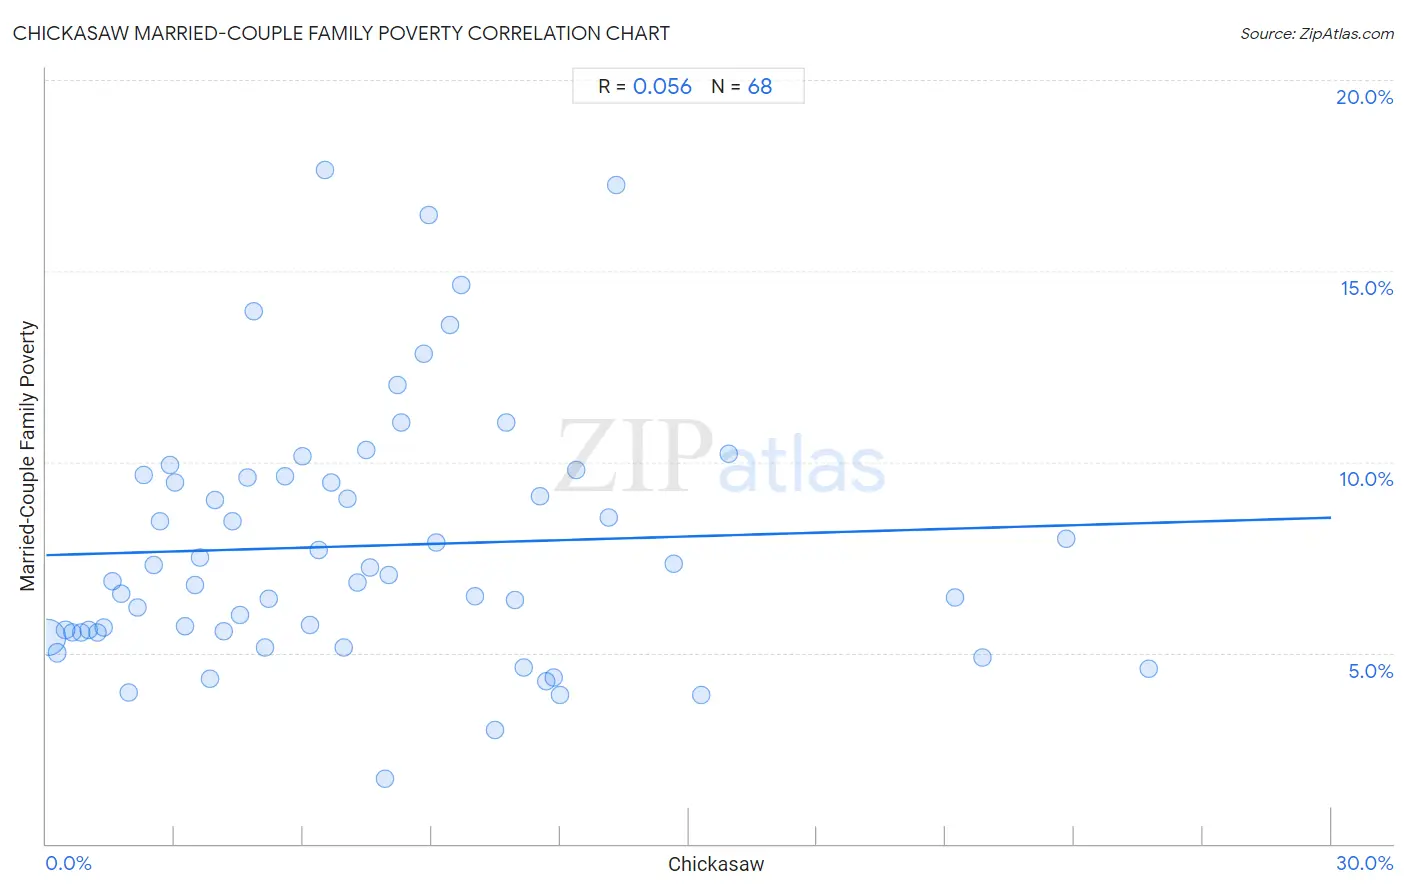
It is essential to understand that the correlation between the percentage of Chickasaw and poverty level among married-couple families does not imply a direct cause-and-effect relationship. It remains uncertain whether the presence of Chickasaw influences an upward or downward trend in the level of poverty level among married-couple families within an area, or if Chickasaw simply ended up residing in those areas with higher or lower levels of poverty level among married-couple families due to other factors.
Demographics Similar to Chickasaw by Married-Couple Family Poverty
In terms of married-couple family poverty, the demographic groups most similar to Chickasaw are Somali (5.8%, a difference of 0.010%), Immigrants from Afghanistan (5.8%, a difference of 0.15%), Immigrants from Western Africa (5.8%, a difference of 0.17%), Immigrants from Panama (5.8%, a difference of 0.26%), and Fijian (5.8%, a difference of 0.28%).
| Demographics | Rating | Rank | Married-Couple Family Poverty |
| Immigrants from South America | 3.1 /100 | #237 | Tragic 5.7% |
| Cherokee | 2.7 /100 | #238 | Tragic 5.8% |
| Venezuelans | 2.7 /100 | #239 | Tragic 5.8% |
| Fijians | 2.5 /100 | #240 | Tragic 5.8% |
| Immigrants from Panama | 2.5 /100 | #241 | Tragic 5.8% |
| Immigrants from Western Africa | 2.4 /100 | #242 | Tragic 5.8% |
| Somalis | 2.3 /100 | #243 | Tragic 5.8% |
| Chickasaw | 2.3 /100 | #244 | Tragic 5.8% |
| Immigrants from Afghanistan | 2.1 /100 | #245 | Tragic 5.8% |
| Immigrants from Venezuela | 1.8 /100 | #246 | Tragic 5.8% |
| Iraqis | 1.4 /100 | #247 | Tragic 5.9% |
| Cree | 1.2 /100 | #248 | Tragic 5.9% |
| Tsimshian | 1.1 /100 | #249 | Tragic 5.9% |
| Immigrants from Eritrea | 1.1 /100 | #250 | Tragic 5.9% |
| Immigrants from Ghana | 1.0 /100 | #251 | Tragic 5.9% |
Chickasaw Married-Couple Family Poverty Correlation Summary
| Measurement | Chickasaw Data | Married-Couple Family Poverty Data |
| Minimum | 0.032% | 1.7% |
| Maximum | 25.7% | 17.6% |
| Range | 25.7% | 16.0% |
| Mean | 7.5% | 7.8% |
| Median | 6.6% | 7.0% |
| Interquartile 25% (IQ1) | 3.1% | 5.5% |
| Interquartile 75% (IQ3) | 10.6% | 9.6% |
| Interquartile Range (IQR) | 7.5% | 4.1% |
| Standard Deviation (Sample) | 5.7% | 3.4% |
| Standard Deviation (Population) | 5.6% | 3.3% |
Correlation Details
| Chickasaw Percentile | Sample Size | Married-Couple Family Poverty |
[ 0.0% - 0.5% ] 0.032% | 136,542,836 | 5.4% |
[ 0.0% - 0.5% ] 0.25% | 5,205,200 | 5.0% |
[ 0.0% - 0.5% ] 0.45% | 1,563,719 | 5.6% |
[ 0.5% - 1.0% ] 0.60% | 1,584,357 | 5.5% |
[ 0.5% - 1.0% ] 0.83% | 812,124 | 5.5% |
[ 0.5% - 1.0% ] 0.98% | 456,539 | 5.6% |
[ 1.0% - 1.5% ] 1.19% | 224,436 | 5.5% |
[ 1.0% - 1.5% ] 1.35% | 245,937 | 5.7% |
[ 1.5% - 2.0% ] 1.54% | 87,823 | 6.9% |
[ 1.5% - 2.0% ] 1.74% | 87,969 | 6.5% |
[ 1.5% - 2.0% ] 1.92% | 50,087 | 3.9% |
[ 2.0% - 2.5% ] 2.13% | 48,029 | 6.2% |
[ 2.0% - 2.5% ] 2.28% | 47,347 | 9.6% |
[ 2.5% - 3.0% ] 2.51% | 15,979 | 7.3% |
[ 2.5% - 3.0% ] 2.66% | 12,890 | 8.4% |
[ 2.5% - 3.0% ] 2.88% | 65,544 | 9.9% |
[ 3.0% - 3.5% ] 3.00% | 18,441 | 9.5% |
[ 3.0% - 3.5% ] 3.24% | 15,660 | 5.7% |
[ 3.0% - 3.5% ] 3.46% | 7,995 | 6.8% |
[ 3.5% - 4.0% ] 3.60% | 4,301 | 7.5% |
[ 3.5% - 4.0% ] 3.83% | 1,750 | 4.3% |
[ 3.5% - 4.0% ] 3.93% | 2,773 | 9.0% |
[ 4.0% - 4.5% ] 4.14% | 4,957 | 5.6% |
[ 4.0% - 4.5% ] 4.35% | 20,308 | 8.4% |
[ 4.5% - 5.0% ] 4.53% | 26,620 | 6.0% |
[ 4.5% - 5.0% ] 4.71% | 4,204 | 9.6% |
[ 4.5% - 5.0% ] 4.86% | 1,997 | 13.9% |
[ 5.0% - 5.5% ] 5.10% | 4,663 | 5.1% |
[ 5.0% - 5.5% ] 5.18% | 40,771 | 6.4% |
[ 5.5% - 6.0% ] 5.56% | 3,847 | 9.6% |
[ 5.5% - 6.0% ] 6.00% | 4,186 | 10.1% |
[ 6.0% - 6.5% ] 6.16% | 438 | 5.7% |
[ 6.0% - 6.5% ] 6.36% | 6,967 | 7.7% |
[ 6.5% - 7.0% ] 6.51% | 215 | 17.6% |
[ 6.5% - 7.0% ] 6.65% | 1,234 | 9.4% |
[ 6.5% - 7.0% ] 6.95% | 4,633 | 5.1% |
[ 7.0% - 7.5% ] 7.04% | 1,108 | 9.0% |
[ 7.0% - 7.5% ] 7.28% | 8,632 | 6.9% |
[ 7.0% - 7.5% ] 7.46% | 2,735 | 10.3% |
[ 7.5% - 8.0% ] 7.56% | 6,148 | 7.2% |
[ 7.5% - 8.0% ] 7.91% | 2,061 | 1.7% |
[ 8.0% - 8.5% ] 8.00% | 350 | 7.0% |
[ 8.0% - 8.5% ] 8.21% | 633 | 12.0% |
[ 8.0% - 8.5% ] 8.29% | 4,329 | 11.0% |
[ 8.5% - 9.0% ] 8.81% | 919 | 12.8% |
[ 8.5% - 9.0% ] 8.94% | 1,219 | 16.5% |
[ 9.0% - 9.5% ] 9.11% | 966 | 7.9% |
[ 9.0% - 9.5% ] 9.44% | 4,841 | 13.6% |
[ 9.5% - 10.0% ] 9.70% | 268 | 14.6% |
[ 10.0% - 10.5% ] 10.00% | 7,518 | 6.5% |
[ 10.0% - 10.5% ] 10.49% | 286 | 3.0% |
[ 10.5% - 11.0% ] 10.75% | 930 | 11.0% |
[ 10.5% - 11.0% ] 10.95% | 5,491 | 6.4% |
[ 11.0% - 11.5% ] 11.15% | 1,283 | 4.6% |
[ 11.5% - 12.0% ] 11.54% | 208 | 9.1% |
[ 11.5% - 12.0% ] 11.68% | 1,473 | 4.3% |
[ 11.5% - 12.0% ] 11.85% | 16,537 | 4.4% |
[ 11.5% - 12.0% ] 11.98% | 31,368 | 3.9% |
[ 12.0% - 12.5% ] 12.37% | 695 | 9.8% |
[ 13.0% - 13.5% ] 13.12% | 7,470 | 8.5% |
[ 13.0% - 13.5% ] 13.31% | 3,110 | 17.3% |
[ 14.5% - 15.0% ] 14.64% | 560 | 7.3% |
[ 15.0% - 15.5% ] 15.30% | 791 | 3.9% |
[ 15.5% - 16.0% ] 15.93% | 841 | 10.2% |
[ 21.0% - 21.5% ] 21.23% | 212 | 6.5% |
[ 21.5% - 22.0% ] 21.86% | 988 | 4.9% |
[ 23.5% - 24.0% ] 23.81% | 189 | 8.0% |
[ 25.5% - 26.0% ] 25.74% | 1,286 | 4.6% |