Macedonian Married-Couple Family Poverty

COMPARE

Macedonian
Race
Ancestry
AfghanAfricanAlaska NativeAlaskan AthabascanAlbanianAleutAlsatianAmericanApacheArabArapahoArgentineanArmenianAssyrian/Chaldean/SyriacAustralianAustrianBahamianBangladeshiBarbadianBasqueBelgianBelizeanBermudanBhutaneseBlackfeetBolivianBrazilianBritishBritish West IndianBulgarianBurmeseCajunCambodianCanadianCape VerdeanCarpatho RusynCelticCentral AmericanCentral American IndianCherokeeCheyenneChickasawChileanChineseChippewaChoctawColombianColvilleComancheCosta RicanCreeCreekCroatianCrowCubanCypriotCzechCzechoslovakianDanishDelawareDominicanDutchDutch West IndianEastern EuropeanEcuadorianEgyptianEnglishEstonianEthiopianEuropeanFijianFilipinoFinnishFrenchFrench American IndianFrench CanadianGermanGerman RussianGhanaianGreekGuamanian/ChamorroGuatemalanGuyaneseHaitianHmongHonduranHopiHoumaHungarianIcelanderIndian (Asian)IndonesianInupiatIranianIraqiIrishIroquoisIsraeliItalianJamaicanJapaneseJordanianKenyanKiowaKoreanLaotianLatvianLebaneseLiberianLithuanianLumbeeLuxembourgerMacedonianMalaysianMalteseMarshalleseMenomineeMexicanMexican American IndianMongolianMoroccanNative HawaiianNavajoNepaleseNew ZealanderNicaraguanNigerianNorthern EuropeanNorwegianOkinawanOsageOttawaPaiutePakistaniPalestinianPanamanianParaguayanPennsylvania GermanPeruvianPimaPolishPortuguesePotawatomiPuebloPuerto RicanPuget Sound SalishRomanianRussianSalvadoranSamoanScandinavianScotch-IrishScottishSeminoleSenegaleseSerbianShoshoneSierra LeoneanSiouxSlavicSlovakSloveneSomaliSouth AfricanSouth AmericanSouth American IndianSoviet UnionSpaniardSpanishSpanish AmericanSpanish American IndianSri LankanSubsaharan AfricanSudaneseSwedishSwissSyrianTaiwaneseThaiTlingit-HaidaTohono O'OdhamTonganTrinidadian and TobagonianTsimshianTurkishU.S. Virgin IslanderUgandanUkrainianUruguayanUteVenezuelanVietnameseWelshWest IndianYakamaYaquiYugoslavianYumanYup'ikZimbabwean
Immigration
NonimmigrantsImmigrantsAfghanistanAfricaAlbaniaArgentinaArmeniaAsiaAustraliaAustriaBahamasBangladeshBarbadosBelarusBelgiumBelizeBoliviaBosnia and HerzegovinaBrazilBulgariaBurma/MyanmarCabo VerdeCambodiaCameroonCanadaCaribbeanCentral AmericaChileChinaColombiaCongoCosta RicaCroatiaCubaCzechoslovakiaDenmarkDominicaDominican RepublicEastern AfricaEastern AsiaEastern EuropeEcuadorEgyptEl SalvadorEnglandEritreaEthiopiaEuropeFijiFranceGermanyGhanaGreeceGrenadaGuatemalaGuyanaHaitiHondurasHong KongHungaryIndiaIndonesiaIranIraqIrelandIsraelItalyJamaicaJapanJordanKazakhstanKenyaKoreaKuwaitLaosLatin AmericaLatviaLebanonLiberiaLithuaniaMalaysiaMexicoMicronesiaMiddle AfricaMoldovaMoroccoNepalNetherlandsNicaraguaNigeriaNorth AmericaNorth MacedoniaNorthern AfricaNorthern EuropeNorwayOceaniaPakistanPanamaPeruPhilippinesPolandPortugalRomaniaRussiaSaudi ArabiaScotlandSenegalSerbiaSierra LeoneSingaporeSomaliaSouth AfricaSouth AmericaSouth Central AsiaSouth Eastern AsiaSouthern EuropeSpainSri LankaSt. Vincent and the GrenadinesSudanSwedenSwitzerlandSyriaTaiwanThailandTrinidad and TobagoTurkeyUgandaUkraineUruguayUzbekistanVenezuelaVietnamWest IndiesWestern AfricaWestern AsiaWestern EuropeYemenZaireZimbabweAzores
Select to Compare
Race
Ancestry
AfghanAfricanAlaska NativeAlaskan AthabascanAlbanianAleutAlsatianAmericanApacheArabArapahoArgentineanArmenianAssyrian/Chaldean/SyriacAustralianAustrianBahamianBangladeshiBarbadianBasqueBelgianBelizeanBermudanBhutaneseBlackfeetBolivianBrazilianBritishBritish West IndianBulgarianBurmeseCajunCambodianCanadianCape VerdeanCarpatho RusynCelticCentral AmericanCentral American IndianCherokeeCheyenneChickasawChileanChineseChippewaChoctawColombianColvilleComancheCosta RicanCreeCreekCroatianCrowCubanCypriotCzechCzechoslovakianDanishDelawareDominicanDutchDutch West IndianEastern EuropeanEcuadorianEgyptianEnglishEstonianEthiopianEuropeanFijianFilipinoFinnishFrenchFrench American IndianFrench CanadianGermanGerman RussianGhanaianGreekGuamanian/ChamorroGuatemalanGuyaneseHaitianHmongHonduranHopiHoumaHungarianIcelanderIndian (Asian)IndonesianInupiatIranianIraqiIrishIroquoisIsraeliItalianJamaicanJapaneseJordanianKenyanKiowaKoreanLaotianLatvianLebaneseLiberianLithuanianLumbeeLuxembourgerMalaysianMalteseMarshalleseMenomineeMexicanMexican American IndianMongolianMoroccanNative HawaiianNavajoNepaleseNew ZealanderNicaraguanNigerianNorthern EuropeanNorwegianOkinawanOsageOttawaPaiutePakistaniPalestinianPanamanianParaguayanPennsylvania GermanPeruvianPimaPolishPortuguesePotawatomiPuebloPuerto RicanPuget Sound SalishRomanianRussianSalvadoranSamoanScandinavianScotch-IrishScottishSeminoleSenegaleseSerbianShoshoneSierra LeoneanSiouxSlavicSlovakSloveneSomaliSouth AfricanSouth AmericanSouth American IndianSoviet UnionSpaniardSpanishSpanish AmericanSpanish American IndianSri LankanSubsaharan AfricanSudaneseSwedishSwissSyrianTaiwaneseThaiTlingit-HaidaTohono O'OdhamTonganTrinidadian and TobagonianTsimshianTurkishU.S. Virgin IslanderUgandanUkrainianUruguayanUteVenezuelanVietnameseWelshWest IndianYakamaYaquiYugoslavianYumanYup'ikZimbabwean
Immigration
NonimmigrantsImmigrantsAfghanistanAfricaAlbaniaArgentinaArmeniaAsiaAustraliaAustriaBahamasBangladeshBarbadosBelarusBelgiumBelizeBoliviaBosnia and HerzegovinaBrazilBulgariaBurma/MyanmarCabo VerdeCambodiaCameroonCanadaCaribbeanCentral AmericaChileChinaColombiaCongoCosta RicaCroatiaCubaCzechoslovakiaDenmarkDominicaDominican RepublicEastern AfricaEastern AsiaEastern EuropeEcuadorEgyptEl SalvadorEnglandEritreaEthiopiaEuropeFijiFranceGermanyGhanaGreeceGrenadaGuatemalaGuyanaHaitiHondurasHong KongHungaryIndiaIndonesiaIranIraqIrelandIsraelItalyJamaicaJapanJordanKazakhstanKenyaKoreaKuwaitLaosLatin AmericaLatviaLebanonLiberiaLithuaniaMalaysiaMexicoMicronesiaMiddle AfricaMoldovaMoroccoNepalNetherlandsNicaraguaNigeriaNorth AmericaNorth MacedoniaNorthern AfricaNorthern EuropeNorwayOceaniaPakistanPanamaPeruPhilippinesPolandPortugalRomaniaRussiaSaudi ArabiaScotlandSenegalSerbiaSierra LeoneSingaporeSomaliaSouth AfricaSouth AmericaSouth Central AsiaSouth Eastern AsiaSouthern EuropeSpainSri LankaSt. Vincent and the GrenadinesSudanSwedenSwitzerlandSyriaTaiwanThailandTrinidad and TobagoTurkeyUgandaUkraineUruguayUzbekistanVenezuelaVietnamWest IndiesWestern AfricaWestern AsiaWestern EuropeYemenZaireZimbabweAzores
Married-Couple Family Poverty
Income
Poverty
Unemployment
Labor Participation
Family Structure
Vehicle Availability
Education Level
Disability

Macedonian Married-Couple Family Poverty
Exceptional

4.4%
POVERTY | MARRIED-COUPLE FAMILIES
99.4/ 100
METRIC RATING
65th/ 347
METRIC RANK

Macedonian Married-Couple Family Poverty Correlation Chart

The statistical analysis conducted on geographies consisting of 132,044,317 people shows no correlation between the proportion of Macedonians and poverty level among married-couple families in the United States with a correlation coefficient (R) of -0.041 and weighted average of 4.4%. On average, for every 1% (one percent) increase in Macedonians within a typical geography, there is a decrease of 0.089% in poverty level among married-couple families.
Macedonian Married-Couple Family Poverty
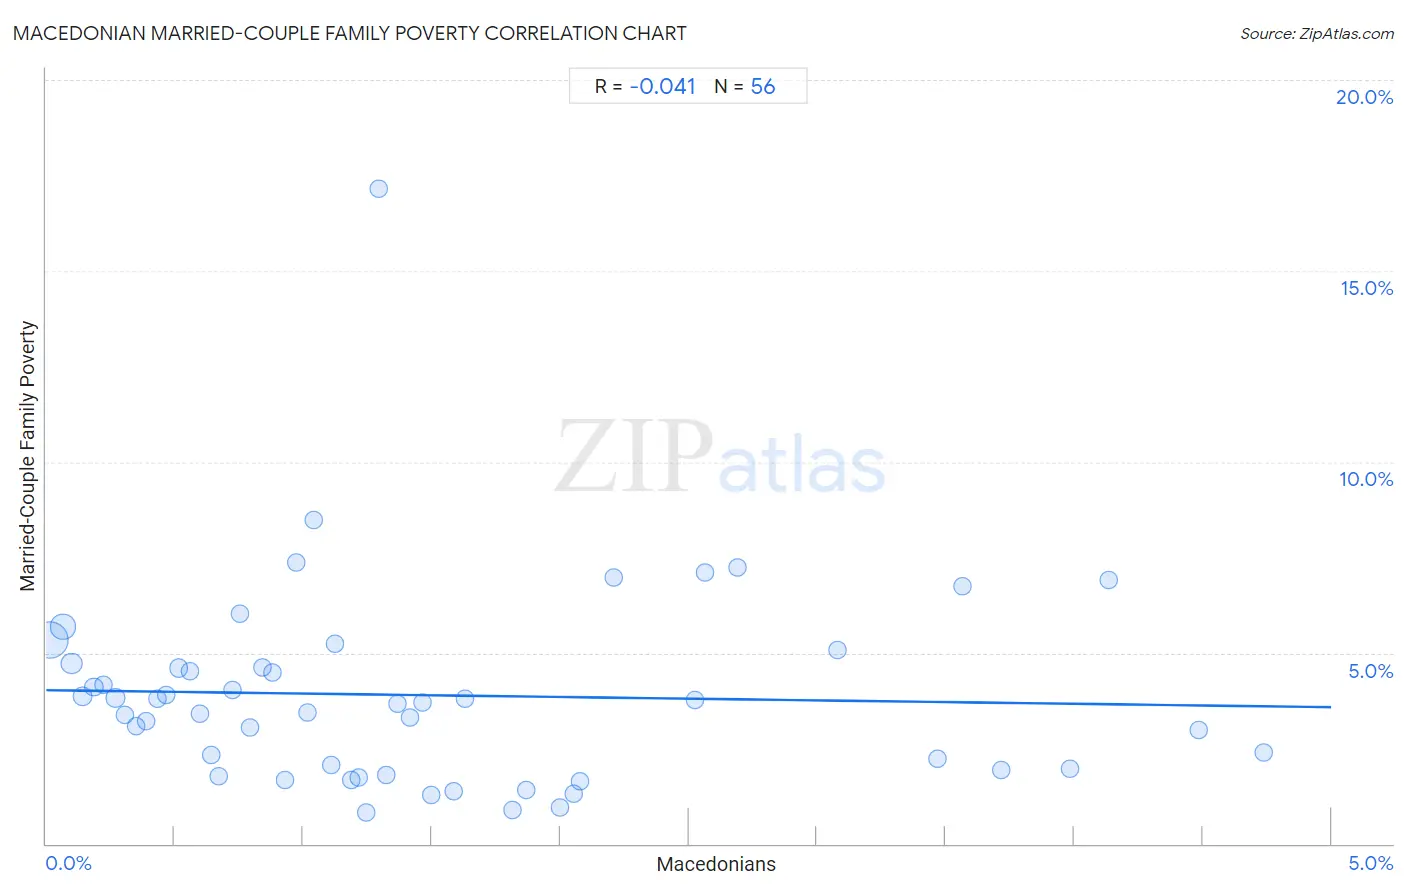
It is essential to understand that the correlation between the percentage of Macedonians and poverty level among married-couple families does not imply a direct cause-and-effect relationship. It remains uncertain whether the presence of Macedonians influences an upward or downward trend in the level of poverty level among married-couple families within an area, or if Macedonians simply ended up residing in those areas with higher or lower levels of poverty level among married-couple families due to other factors.

Demographics Similar to Macedonians by Married-Couple Family Poverty

In terms of married-couple family poverty, the demographic groups most similar to Macedonians are Immigrants from Serbia (4.4%, a difference of 0.13%), Immigrants from Canada (4.4%, a difference of 0.18%), Slavic (4.4%, a difference of 0.19%), New Zealander (4.4%, a difference of 0.20%), and Immigrants from Korea (4.5%, a difference of 0.34%).
DemographicsRating | RankMarried-Couple Family Poverty
Czechoslovakians
99.7
/100
|
#58
Exceptional
4.4%
Immigrants from Sweden
99.6
/100
|
#59
Exceptional
4.4%
Tlingit-Haida
99.6
/100
|
#60
Exceptional
4.4%
Okinawans
99.6
/100
|
#61
Exceptional
4.4%
Immigrants from Australia
99.6
/100
|
#62
Exceptional
4.4%
Immigrants from Sri Lanka
99.6
/100
|
#63
Exceptional
4.4%
Immigrants from Bulgaria
99.5
/100
|
#64
Exceptional
4.4%
Macedonians
99.4
/100
|
#65
Exceptional
4.4%
Immigrants from Serbia
99.4
/100
|
#66
Exceptional
4.4%
Immigrants from Canada
99.4
/100
|
#67
Exceptional
4.4%
Slavs
99.4
/100
|
#68
Exceptional
4.4%
New Zealanders
99.4
/100
|
#69
Exceptional
4.4%
Immigrants from Korea
99.4
/100
|
#70
Exceptional
4.5%
Immigrants from North America
99.3
/100
|
#71
Exceptional
4.5%
Immigrants from England
99.3
/100
|
#72
Exceptional
4.5%

Macedonian Married-Couple Family Poverty Correlation Summary

MeasurementMacedonian DataMarried-Couple Family Poverty Data
Minimum0.016%0.82%
Maximum4.7%17.2%
Range4.7%16.3%
Mean1.5%3.9%
Median1.2%3.7%
Interquartile 25% (IQ1)0.58%2.0%
Interquartile 75% (IQ3)2.0%4.7%
Interquartile Range (IQR)1.4%2.7%
Standard Deviation (Sample)1.2%2.6%
Standard Deviation (Population)1.2%2.6%

Correlation Details

Macedonian PercentileSample SizeMarried-Couple Family Poverty
[
0.0%
-
0.5%
]
0.016%
75,238,2375.3%
[
0.0%
-
0.5%
]
0.065%
26,149,0165.7%
[
0.0%
-
0.5%
]
0.098%
11,828,6994.7%
[
0.0%
-
0.5%
]
0.14%
4,432,3473.9%
[
0.0%
-
0.5%
]
0.18%
4,047,2094.1%
[
0.0%
-
0.5%
]
0.22%
2,048,7544.2%
[
0.0%
-
0.5%
]
0.27%
1,352,9893.8%
[
0.0%
-
0.5%
]
0.31%
718,2553.4%
[
0.0%
-
0.5%
]
0.35%
973,0873.1%
[
0.0%
-
0.5%
]
0.39%
933,7743.2%
[
0.0%
-
0.5%
]
0.43%
339,1423.8%
[
0.0%
-
0.5%
]
0.47%
380,5173.9%
[
0.5%
-
1.0%
]
0.51%
412,2364.6%
[
0.5%
-
1.0%
]
0.56%
306,7104.5%
[
0.5%
-
1.0%
]
0.60%
312,4273.4%
[
0.5%
-
1.0%
]
0.64%
181,3082.3%
[
0.5%
-
1.0%
]
0.67%
224,8351.8%
[
0.5%
-
1.0%
]
0.72%
221,5834.0%
[
0.5%
-
1.0%
]
0.75%
249,1516.0%
[
0.5%
-
1.0%
]
0.79%
164,9793.0%
[
0.5%
-
1.0%
]
0.84%
255,0274.6%
[
0.5%
-
1.0%
]
0.88%
82,5644.5%
[
0.5%
-
1.0%
]
0.93%
54,1261.7%
[
0.5%
-
1.0%
]
0.97%
40,4947.4%
[
1.0%
-
1.5%
]
1.02%
24,3053.4%
[
1.0%
-
1.5%
]
1.04%
140,6438.5%
[
1.0%
-
1.5%
]
1.11%
34,4032.1%
[
1.0%
-
1.5%
]
1.12%
43,7565.2%
[
1.0%
-
1.5%
]
1.19%
72,7191.7%
[
1.0%
-
1.5%
]
1.22%
114,4751.7%
[
1.0%
-
1.5%
]
1.24%
81,9510.82%
[
1.0%
-
1.5%
]
1.29%
41,61017.2%
[
1.0%
-
1.5%
]
1.32%
1,5901.8%
[
1.0%
-
1.5%
]
1.37%
62,0473.7%
[
1.0%
-
1.5%
]
1.42%
13,7783.3%
[
1.0%
-
1.5%
]
1.46%
51,9393.7%
[
1.0%
-
1.5%
]
1.50%
14,0721.3%
[
1.5%
-
2.0%
]
1.59%
119,7161.4%
[
1.5%
-
2.0%
]
1.63%
24,3333.8%
[
1.5%
-
2.0%
]
1.81%
39,8230.87%
[
1.5%
-
2.0%
]
1.87%
7,7631.4%
[
2.0%
-
2.5%
]
2.00%
9500.93%
[
2.0%
-
2.5%
]
2.05%
5361.3%
[
2.0%
-
2.5%
]
2.07%
19,9561.7%
[
2.0%
-
2.5%
]
2.21%
2,7647.0%
[
2.5%
-
3.0%
]
2.52%
32,1933.8%
[
2.5%
-
3.0%
]
2.57%
5,1857.1%
[
2.5%
-
3.0%
]
2.69%
42,5227.2%
[
3.0%
-
3.5%
]
3.08%
1,6255.1%
[
3.0%
-
3.5%
]
3.47%
2,9992.2%
[
3.5%
-
4.0%
]
3.57%
64,9446.7%
[
3.5%
-
4.0%
]
3.72%
6,3221.9%
[
3.5%
-
4.0%
]
3.99%
4,9932.0%
[
4.0%
-
4.5%
]
4.14%
2666.9%
[
4.0%
-
4.5%
]
4.49%
2,3633.0%
[
4.5%
-
5.0%
]
4.74%
20,3102.4%