Immigrants from Greece Married-Couple Family Poverty
COMPARE
Immigrants from Greece
Select to Compare
Married-Couple Family Poverty
Immigrants from Greece Married-Couple Family Poverty
4.5%
POVERTY | MARRIED-COUPLE FAMILIES
98.9/ 100
METRIC RATING
81st/ 347
METRIC RANK
Immigrants from Greece Married-Couple Family Poverty Correlation Chart
The statistical analysis conducted on geographies consisting of 215,639,797 people shows a very strong positive correlation between the proportion of Immigrants from Greece and poverty level among married-couple families in the United States with a correlation coefficient (R) of 0.837 and weighted average of 4.5%. On average, for every 1% (one percent) increase in Immigrants from Greece within a typical geography, there is an increase of 1.8% in poverty level among married-couple families.
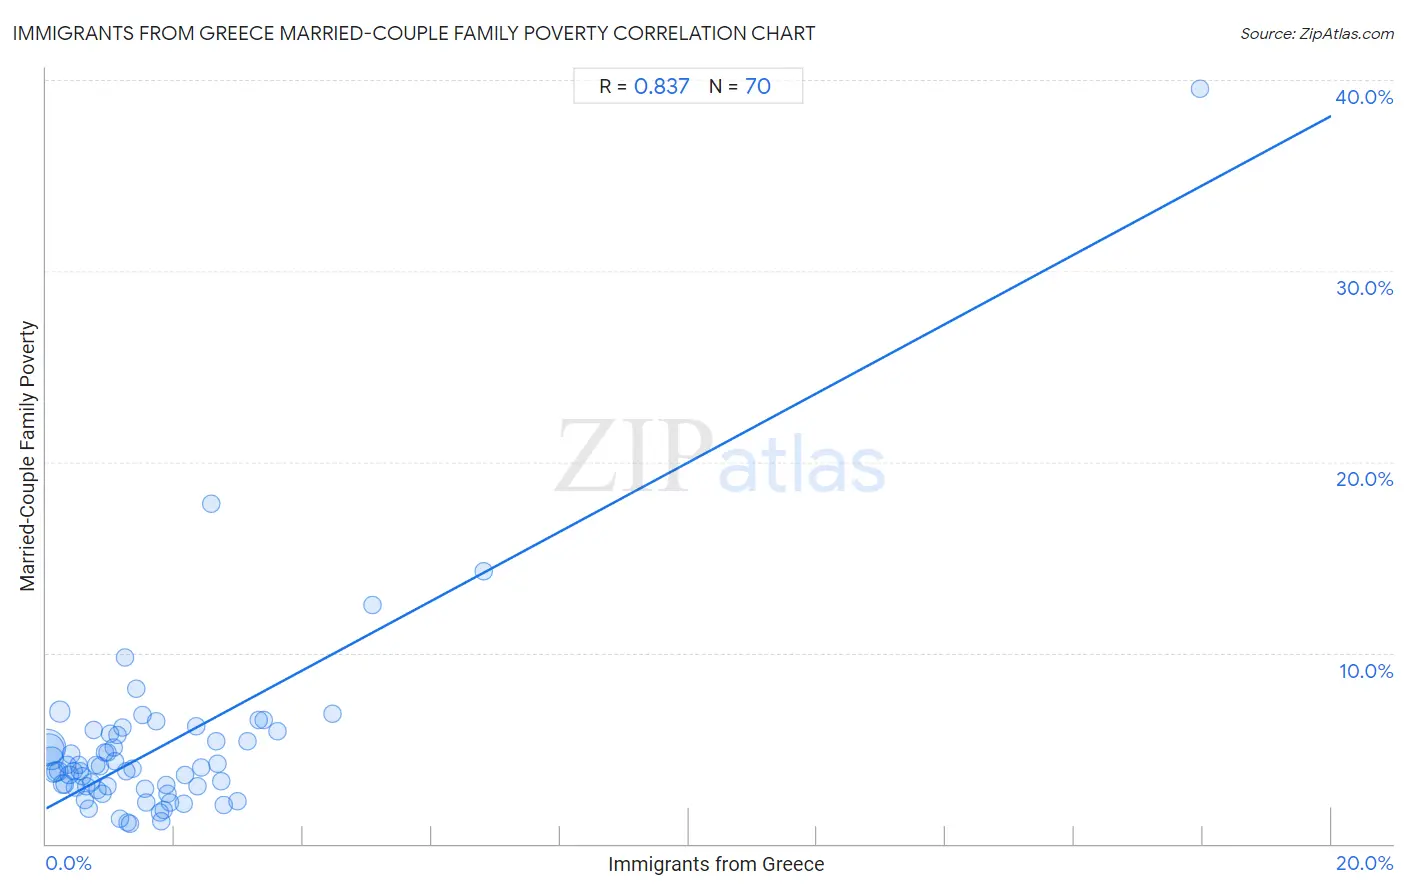
It is essential to understand that the correlation between the percentage of Immigrants from Greece and poverty level among married-couple families does not imply a direct cause-and-effect relationship. It remains uncertain whether the presence of Immigrants from Greece influences an upward or downward trend in the level of poverty level among married-couple families within an area, or if Immigrants from Greece simply ended up residing in those areas with higher or lower levels of poverty level among married-couple families due to other factors.
Demographics Similar to Immigrants from Greece by Married-Couple Family Poverty
In terms of married-couple family poverty, the demographic groups most similar to Immigrants from Greece are Icelander (4.5%, a difference of 0.14%), Immigrants from Iran (4.5%, a difference of 0.20%), Canadian (4.5%, a difference of 0.25%), Immigrants from Denmark (4.6%, a difference of 0.41%), and Scotch-Irish (4.5%, a difference of 0.44%).
| Demographics | Rating | Rank | Married-Couple Family Poverty |
| Immigrants from Austria | 99.2 /100 | #74 | Exceptional 4.5% |
| Cambodians | 99.2 /100 | #75 | Exceptional 4.5% |
| Immigrants from South Africa | 99.1 /100 | #76 | Exceptional 4.5% |
| Immigrants from Latvia | 99.1 /100 | #77 | Exceptional 4.5% |
| Scotch-Irish | 99.1 /100 | #78 | Exceptional 4.5% |
| Immigrants from Iran | 99.0 /100 | #79 | Exceptional 4.5% |
| Icelanders | 99.0 /100 | #80 | Exceptional 4.5% |
| Immigrants from Greece | 98.9 /100 | #81 | Exceptional 4.5% |
| Canadians | 98.8 /100 | #82 | Exceptional 4.5% |
| Immigrants from Denmark | 98.8 /100 | #83 | Exceptional 4.6% |
| Immigrants from Croatia | 98.7 /100 | #84 | Exceptional 4.6% |
| South Africans | 98.7 /100 | #85 | Exceptional 4.6% |
| Immigrants from Turkey | 98.6 /100 | #86 | Exceptional 4.6% |
| Immigrants from North Macedonia | 98.6 /100 | #87 | Exceptional 4.6% |
| Bolivians | 98.6 /100 | #88 | Exceptional 4.6% |
Immigrants from Greece Married-Couple Family Poverty Correlation Summary
| Measurement | Immigrants from Greece Data | Married-Couple Family Poverty Data |
| Minimum | 0.018% | 1.1% |
| Maximum | 17.9% | 39.5% |
| Range | 17.9% | 38.5% |
| Mean | 1.7% | 5.0% |
| Median | 1.2% | 3.9% |
| Interquartile 25% (IQ1) | 0.59% | 3.0% |
| Interquartile 75% (IQ3) | 2.2% | 5.7% |
| Interquartile Range (IQR) | 1.6% | 2.7% |
| Standard Deviation (Sample) | 2.3% | 5.1% |
| Standard Deviation (Population) | 2.3% | 5.0% |
Correlation Details
| Immigrants from Greece Percentile | Sample Size | Married-Couple Family Poverty |
[ 0.0% - 0.5% ] 0.018% | 81,490,008 | 5.0% |
[ 0.0% - 0.5% ] 0.048% | 52,796,008 | 5.0% |
[ 0.0% - 0.5% ] 0.085% | 25,417,202 | 4.5% |
[ 0.0% - 0.5% ] 0.12% | 11,893,739 | 3.8% |
[ 0.0% - 0.5% ] 0.15% | 7,776,762 | 3.8% |
[ 0.0% - 0.5% ] 0.19% | 6,131,979 | 3.8% |
[ 0.0% - 0.5% ] 0.22% | 12,472,785 | 6.9% |
[ 0.0% - 0.5% ] 0.25% | 3,438,532 | 3.1% |
[ 0.0% - 0.5% ] 0.29% | 2,676,367 | 3.1% |
[ 0.0% - 0.5% ] 0.33% | 1,491,416 | 4.1% |
[ 0.0% - 0.5% ] 0.36% | 1,228,915 | 3.6% |
[ 0.0% - 0.5% ] 0.39% | 1,484,375 | 4.7% |
[ 0.0% - 0.5% ] 0.43% | 840,883 | 3.8% |
[ 0.0% - 0.5% ] 0.46% | 751,064 | 3.0% |
[ 0.0% - 0.5% ] 0.50% | 489,724 | 4.1% |
[ 0.5% - 1.0% ] 0.53% | 574,429 | 3.8% |
[ 0.5% - 1.0% ] 0.56% | 534,702 | 3.6% |
[ 0.5% - 1.0% ] 0.59% | 385,958 | 2.3% |
[ 0.5% - 1.0% ] 0.63% | 230,000 | 3.0% |
[ 0.5% - 1.0% ] 0.66% | 320,172 | 1.9% |
[ 0.5% - 1.0% ] 0.70% | 407,639 | 3.2% |
[ 0.5% - 1.0% ] 0.74% | 428,755 | 5.9% |
[ 0.5% - 1.0% ] 0.77% | 257,716 | 4.1% |
[ 0.5% - 1.0% ] 0.80% | 184,874 | 2.8% |
[ 0.5% - 1.0% ] 0.84% | 96,964 | 4.0% |
[ 0.5% - 1.0% ] 0.88% | 103,539 | 2.6% |
[ 0.5% - 1.0% ] 0.91% | 325,161 | 4.8% |
[ 0.5% - 1.0% ] 0.94% | 129,053 | 3.0% |
[ 0.5% - 1.0% ] 0.96% | 80,297 | 4.8% |
[ 1.0% - 1.5% ] 1.00% | 78,045 | 5.8% |
[ 1.0% - 1.5% ] 1.05% | 43,642 | 5.0% |
[ 1.0% - 1.5% ] 1.07% | 189,052 | 4.3% |
[ 1.0% - 1.5% ] 1.11% | 68,827 | 5.7% |
[ 1.0% - 1.5% ] 1.14% | 51,082 | 1.3% |
[ 1.0% - 1.5% ] 1.18% | 33,669 | 6.1% |
[ 1.0% - 1.5% ] 1.22% | 15,324 | 9.8% |
[ 1.0% - 1.5% ] 1.25% | 147,609 | 3.8% |
[ 1.0% - 1.5% ] 1.26% | 17,965 | 1.1% |
[ 1.0% - 1.5% ] 1.31% | 20,038 | 1.1% |
[ 1.0% - 1.5% ] 1.35% | 29,920 | 3.9% |
[ 1.0% - 1.5% ] 1.41% | 48,615 | 8.1% |
[ 1.0% - 1.5% ] 1.49% | 43,367 | 6.8% |
[ 1.5% - 2.0% ] 1.53% | 35,356 | 2.9% |
[ 1.5% - 2.0% ] 1.55% | 15,698 | 2.2% |
[ 1.5% - 2.0% ] 1.72% | 57,708 | 6.4% |
[ 1.5% - 2.0% ] 1.77% | 5,939 | 1.6% |
[ 1.5% - 2.0% ] 1.79% | 2,514 | 1.2% |
[ 1.5% - 2.0% ] 1.83% | 3,277 | 1.8% |
[ 1.5% - 2.0% ] 1.86% | 10,439 | 3.1% |
[ 1.5% - 2.0% ] 1.89% | 317 | 2.6% |
[ 1.5% - 2.0% ] 1.93% | 1,810 | 2.2% |
[ 2.0% - 2.5% ] 2.13% | 2,440 | 2.1% |
[ 2.0% - 2.5% ] 2.15% | 42,792 | 3.6% |
[ 2.0% - 2.5% ] 2.34% | 37,647 | 6.2% |
[ 2.0% - 2.5% ] 2.36% | 27,076 | 3.0% |
[ 2.0% - 2.5% ] 2.41% | 27,959 | 4.0% |
[ 2.5% - 3.0% ] 2.57% | 272 | 17.8% |
[ 2.5% - 3.0% ] 2.65% | 34,752 | 5.3% |
[ 2.5% - 3.0% ] 2.66% | 19,719 | 4.2% |
[ 2.5% - 3.0% ] 2.72% | 588 | 3.3% |
[ 2.5% - 3.0% ] 2.76% | 8,565 | 2.1% |
[ 2.5% - 3.0% ] 2.98% | 1,880 | 2.3% |
[ 3.0% - 3.5% ] 3.14% | 7,365 | 5.4% |
[ 3.0% - 3.5% ] 3.31% | 28,882 | 6.5% |
[ 3.0% - 3.5% ] 3.38% | 503 | 6.5% |
[ 3.5% - 4.0% ] 3.60% | 694 | 5.9% |
[ 4.0% - 4.5% ] 4.45% | 38,756 | 6.8% |
[ 5.0% - 5.5% ] 5.08% | 354 | 12.5% |
[ 6.5% - 7.0% ] 6.82% | 88 | 14.3% |
[ 17.5% - 18.0% ] 17.95% | 234 | 39.5% |