Immigrants from Jamaica Married-Couple Family Poverty
COMPARE
Immigrants from Jamaica
Select to Compare
Married-Couple Family Poverty
Immigrants from Jamaica Married-Couple Family Poverty
6.2%
POVERTY | MARRIED-COUPLE FAMILIES
0.1/ 100
METRIC RATING
270th/ 347
METRIC RANK
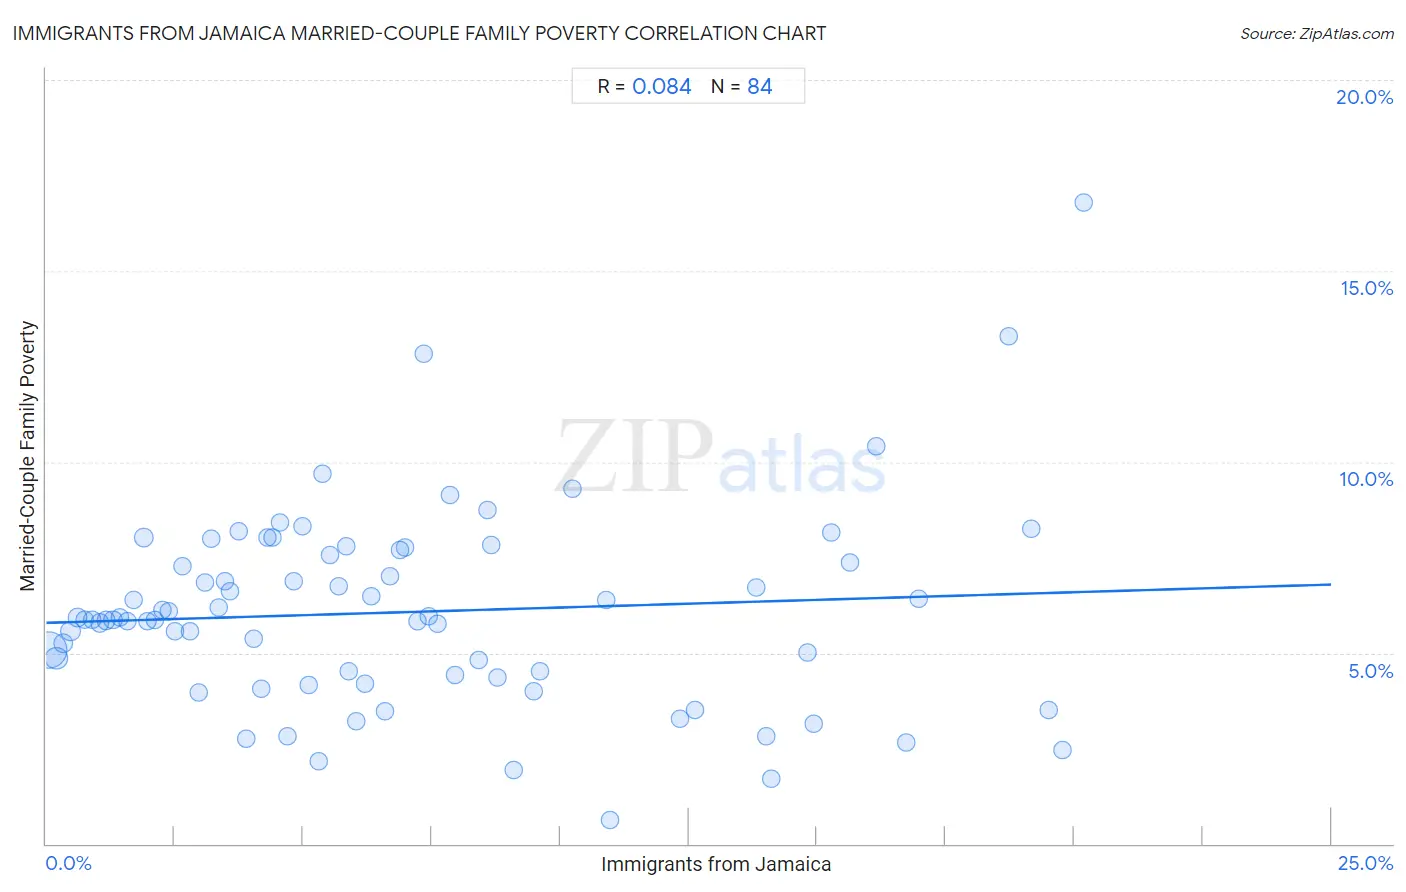
Immigrants from Jamaica Married-Couple Family Poverty Correlation Chart
The statistical analysis conducted on geographies consisting of 299,624,041 people shows a slight positive correlation between the proportion of Immigrants from Jamaica and poverty level among married-couple families in the United States with a correlation coefficient (R) of 0.084 and weighted average of 6.2%. On average, for every 1% (one percent) increase in Immigrants from Jamaica within a typical geography, there is an increase of 0.040% in poverty level among married-couple families.
It is essential to understand that the correlation between the percentage of Immigrants from Jamaica and poverty level among married-couple families does not imply a direct cause-and-effect relationship. It remains uncertain whether the presence of Immigrants from Jamaica influences an upward or downward trend in the level of poverty level among married-couple families within an area, or if Immigrants from Jamaica simply ended up residing in those areas with higher or lower levels of poverty level among married-couple families due to other factors.
Demographics Similar to Immigrants from Jamaica by Married-Couple Family Poverty
In terms of married-couple family poverty, the demographic groups most similar to Immigrants from Jamaica are Immigrants from West Indies (6.2%, a difference of 0.040%), Alaska Native (6.2%, a difference of 0.21%), Immigrants from Bahamas (6.2%, a difference of 0.22%), Trinidadian and Tobagonian (6.2%, a difference of 0.25%), and Spanish American (6.2%, a difference of 0.69%).
| Demographics | Rating | Rank | Married-Couple Family Poverty |
| Immigrants from Senegal | 0.3 /100 | #263 | Tragic 6.1% |
| Immigrants from Congo | 0.2 /100 | #264 | Tragic 6.1% |
| Blackfeet | 0.2 /100 | #265 | Tragic 6.2% |
| Creek | 0.2 /100 | #266 | Tragic 6.2% |
| Spanish Americans | 0.2 /100 | #267 | Tragic 6.2% |
| Alaska Natives | 0.2 /100 | #268 | Tragic 6.2% |
| Immigrants from West Indies | 0.1 /100 | #269 | Tragic 6.2% |
| Immigrants from Jamaica | 0.1 /100 | #270 | Tragic 6.2% |
| Immigrants from Bahamas | 0.1 /100 | #271 | Tragic 6.2% |
| Trinidadians and Tobagonians | 0.1 /100 | #272 | Tragic 6.2% |
| Colville | 0.1 /100 | #273 | Tragic 6.3% |
| Barbadians | 0.1 /100 | #274 | Tragic 6.3% |
| Choctaw | 0.1 /100 | #275 | Tragic 6.3% |
| Yaqui | 0.1 /100 | #276 | Tragic 6.3% |
| Indonesians | 0.1 /100 | #277 | Tragic 6.3% |
Immigrants from Jamaica Married-Couple Family Poverty Correlation Summary
| Measurement | Immigrants from Jamaica Data | Married-Couple Family Poverty Data |
| Minimum | 0.055% | 0.61% |
| Maximum | 20.2% | 16.8% |
| Range | 20.1% | 16.2% |
| Mean | 7.1% | 6.1% |
| Median | 5.8% | 5.9% |
| Interquartile 25% (IQ1) | 2.9% | 4.4% |
| Interquartile 75% (IQ3) | 9.5% | 7.6% |
| Interquartile Range (IQR) | 6.7% | 3.2% |
| Standard Deviation (Sample) | 5.4% | 2.6% |
| Standard Deviation (Population) | 5.4% | 2.6% |
Correlation Details
| Immigrants from Jamaica Percentile | Sample Size | Married-Couple Family Poverty |
[ 0.0% - 0.5% ] 0.055% | 166,938,237 | 5.1% |
[ 0.0% - 0.5% ] 0.19% | 41,417,171 | 4.9% |
[ 0.0% - 0.5% ] 0.33% | 20,180,004 | 5.3% |
[ 0.0% - 0.5% ] 0.47% | 12,653,316 | 5.6% |
[ 0.5% - 1.0% ] 0.61% | 10,697,692 | 5.9% |
[ 0.5% - 1.0% ] 0.74% | 5,698,195 | 5.9% |
[ 0.5% - 1.0% ] 0.89% | 4,729,453 | 5.9% |
[ 1.0% - 1.5% ] 1.04% | 3,448,224 | 5.8% |
[ 1.0% - 1.5% ] 1.16% | 3,479,509 | 5.8% |
[ 1.0% - 1.5% ] 1.30% | 2,523,485 | 5.9% |
[ 1.0% - 1.5% ] 1.42% | 1,648,277 | 5.9% |
[ 1.5% - 2.0% ] 1.57% | 1,937,349 | 5.8% |
[ 1.5% - 2.0% ] 1.70% | 1,499,130 | 6.4% |
[ 1.5% - 2.0% ] 1.89% | 10,058,505 | 8.0% |
[ 1.5% - 2.0% ] 1.96% | 1,068,310 | 5.8% |
[ 2.0% - 2.5% ] 2.13% | 1,058,873 | 5.9% |
[ 2.0% - 2.5% ] 2.26% | 643,904 | 6.1% |
[ 2.0% - 2.5% ] 2.38% | 424,128 | 6.1% |
[ 2.5% - 3.0% ] 2.52% | 570,420 | 5.6% |
[ 2.5% - 3.0% ] 2.66% | 693,251 | 7.3% |
[ 2.5% - 3.0% ] 2.80% | 245,777 | 5.6% |
[ 2.5% - 3.0% ] 2.96% | 433,127 | 4.0% |
[ 3.0% - 3.5% ] 3.08% | 253,385 | 6.9% |
[ 3.0% - 3.5% ] 3.21% | 370,604 | 8.0% |
[ 3.0% - 3.5% ] 3.35% | 441,344 | 6.2% |
[ 3.0% - 3.5% ] 3.48% | 456,973 | 6.9% |
[ 3.5% - 4.0% ] 3.58% | 303,392 | 6.6% |
[ 3.5% - 4.0% ] 3.74% | 206,681 | 8.2% |
[ 3.5% - 4.0% ] 3.89% | 175,651 | 2.7% |
[ 4.0% - 4.5% ] 4.04% | 270,272 | 5.4% |
[ 4.0% - 4.5% ] 4.18% | 222,343 | 4.1% |
[ 4.0% - 4.5% ] 4.31% | 123,551 | 8.0% |
[ 4.0% - 4.5% ] 4.41% | 233,758 | 8.0% |
[ 4.5% - 5.0% ] 4.55% | 230,450 | 8.4% |
[ 4.5% - 5.0% ] 4.69% | 165,396 | 2.8% |
[ 4.5% - 5.0% ] 4.81% | 45,541 | 6.9% |
[ 4.5% - 5.0% ] 5.00% | 287,362 | 8.3% |
[ 5.0% - 5.5% ] 5.11% | 173,323 | 4.2% |
[ 5.0% - 5.5% ] 5.30% | 40,206 | 2.2% |
[ 5.0% - 5.5% ] 5.37% | 135,265 | 9.7% |
[ 5.5% - 6.0% ] 5.53% | 133,648 | 7.6% |
[ 5.5% - 6.0% ] 5.69% | 285,904 | 6.7% |
[ 5.5% - 6.0% ] 5.83% | 149,816 | 7.8% |
[ 5.5% - 6.0% ] 5.89% | 129,918 | 4.5% |
[ 6.0% - 6.5% ] 6.04% | 47,505 | 3.2% |
[ 6.0% - 6.5% ] 6.20% | 52,257 | 4.2% |
[ 6.0% - 6.5% ] 6.32% | 66,937 | 6.5% |
[ 6.5% - 7.0% ] 6.59% | 103,522 | 3.5% |
[ 6.5% - 7.0% ] 6.70% | 92,706 | 7.0% |
[ 6.5% - 7.0% ] 6.88% | 62,464 | 7.7% |
[ 6.5% - 7.0% ] 6.97% | 43,908 | 7.8% |
[ 7.0% - 7.5% ] 7.21% | 146,869 | 5.8% |
[ 7.0% - 7.5% ] 7.33% | 226,412 | 12.8% |
[ 7.0% - 7.5% ] 7.45% | 146,631 | 6.0% |
[ 7.5% - 8.0% ] 7.60% | 17,178 | 5.7% |
[ 7.5% - 8.0% ] 7.86% | 175,260 | 9.1% |
[ 7.5% - 8.0% ] 7.94% | 135,158 | 4.4% |
[ 8.0% - 8.5% ] 8.42% | 71,578 | 4.8% |
[ 8.5% - 9.0% ] 8.58% | 2,867 | 8.7% |
[ 8.5% - 9.0% ] 8.67% | 221,580 | 7.8% |
[ 8.5% - 9.0% ] 8.78% | 2,233 | 4.4% |
[ 9.0% - 9.5% ] 9.10% | 22,099 | 1.9% |
[ 9.0% - 9.5% ] 9.48% | 43,517 | 4.0% |
[ 9.5% - 10.0% ] 9.61% | 739 | 4.5% |
[ 10.0% - 10.5% ] 10.24% | 13,781 | 9.3% |
[ 10.5% - 11.0% ] 10.88% | 79,161 | 6.4% |
[ 10.5% - 11.0% ] 10.97% | 21,460 | 0.61% |
[ 12.0% - 12.5% ] 12.32% | 68,182 | 3.3% |
[ 12.5% - 13.0% ] 12.63% | 127,927 | 3.5% |
[ 13.5% - 14.0% ] 13.81% | 71,862 | 6.7% |
[ 14.0% - 14.5% ] 14.01% | 32,296 | 2.8% |
[ 14.0% - 14.5% ] 14.12% | 21,329 | 1.7% |
[ 14.5% - 15.0% ] 14.81% | 117,452 | 5.0% |
[ 14.5% - 15.0% ] 14.93% | 40,593 | 3.2% |
[ 15.0% - 15.5% ] 15.27% | 62,232 | 8.2% |
[ 15.5% - 16.0% ] 15.63% | 52,792 | 7.4% |
[ 16.0% - 16.5% ] 16.14% | 72,273 | 10.4% |
[ 16.5% - 17.0% ] 16.72% | 84,905 | 2.6% |
[ 16.5% - 17.0% ] 16.98% | 73,987 | 6.4% |
[ 18.5% - 19.0% ] 18.73% | 35,914 | 13.3% |
[ 19.0% - 19.5% ] 19.17% | 52,000 | 8.2% |
[ 19.0% - 19.5% ] 19.50% | 21,977 | 3.5% |
[ 19.5% - 20.0% ] 19.78% | 10,526 | 2.5% |
[ 20.0% - 20.5% ] 20.19% | 852 | 16.8% |