Assyrian/Chaldean/Syriac Married-Couple Family Poverty
COMPARE
Assyrian/Chaldean/Syriac
Select to Compare
Married-Couple Family Poverty
Assyrian/Chaldean/Syriac Married-Couple Family Poverty
4.9%
POVERTY | MARRIED-COUPLE FAMILIES
89.4/ 100
METRIC RATING
135th/ 347
METRIC RANK
Assyrian/Chaldean/Syriac Married-Couple Family Poverty Correlation Chart
The statistical analysis conducted on geographies consisting of 109,936,047 people shows a weak positive correlation between the proportion of Assyrians/Chaldeans/Syriacs and poverty level among married-couple families in the United States with a correlation coefficient (R) of 0.234 and weighted average of 4.9%. On average, for every 1% (one percent) increase in Assyrians/Chaldeans/Syriacs within a typical geography, there is an increase of 0.14% in poverty level among married-couple families.
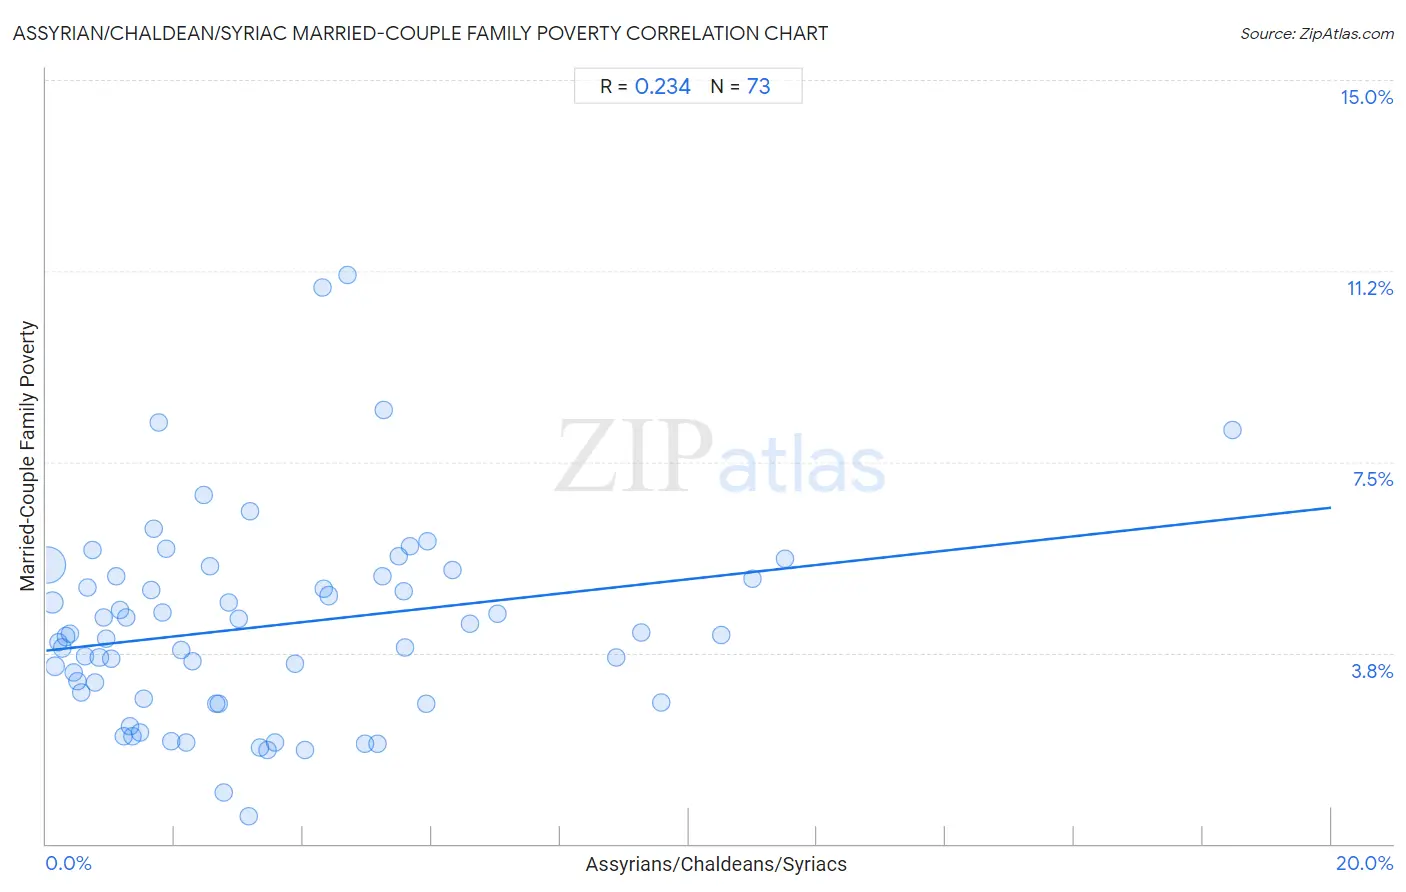
It is essential to understand that the correlation between the percentage of Assyrians/Chaldeans/Syriacs and poverty level among married-couple families does not imply a direct cause-and-effect relationship. It remains uncertain whether the presence of Assyrians/Chaldeans/Syriacs influences an upward or downward trend in the level of poverty level among married-couple families within an area, or if Assyrians/Chaldeans/Syriacs simply ended up residing in those areas with higher or lower levels of poverty level among married-couple families due to other factors.
Demographics Similar to Assyrians/Chaldeans/Syriacs by Married-Couple Family Poverty
In terms of married-couple family poverty, the demographic groups most similar to Assyrians/Chaldeans/Syriacs are Immigrants from Hungary (4.9%, a difference of 0.22%), Samoan (4.9%, a difference of 0.28%), Immigrants from Kenya (4.9%, a difference of 0.29%), Puget Sound Salish (4.9%, a difference of 0.36%), and Immigrants from Eastern Europe (4.9%, a difference of 0.37%).
| Demographics | Rating | Rank | Married-Couple Family Poverty |
| Palestinians | 91.2 /100 | #128 | Exceptional 4.9% |
| Immigrants from Pakistan | 90.7 /100 | #129 | Exceptional 4.9% |
| Soviet Union | 90.7 /100 | #130 | Exceptional 4.9% |
| Immigrants from Eastern Europe | 90.5 /100 | #131 | Exceptional 4.9% |
| Puget Sound Salish | 90.4 /100 | #132 | Exceptional 4.9% |
| Immigrants from Kenya | 90.2 /100 | #133 | Exceptional 4.9% |
| Samoans | 90.2 /100 | #134 | Exceptional 4.9% |
| Assyrians/Chaldeans/Syriacs | 89.4 /100 | #135 | Excellent 4.9% |
| Immigrants from Hungary | 88.7 /100 | #136 | Excellent 4.9% |
| Guamanians/Chamorros | 86.5 /100 | #137 | Excellent 4.9% |
| Chileans | 86.0 /100 | #138 | Excellent 4.9% |
| German Russians | 85.1 /100 | #139 | Excellent 5.0% |
| Immigrants from Portugal | 84.8 /100 | #140 | Excellent 5.0% |
| Immigrants from Brazil | 84.6 /100 | #141 | Excellent 5.0% |
| Immigrants from China | 84.6 /100 | #142 | Excellent 5.0% |
Assyrian/Chaldean/Syriac Married-Couple Family Poverty Correlation Summary
| Measurement | Assyrian/Chaldean/Syriac Data | Married-Couple Family Poverty Data |
| Minimum | 0.017% | 0.54% |
| Maximum | 18.5% | 11.2% |
| Range | 18.5% | 10.6% |
| Mean | 3.4% | 4.3% |
| Median | 2.6% | 4.1% |
| Interquartile 25% (IQ1) | 1.1% | 2.8% |
| Interquartile 75% (IQ3) | 5.2% | 5.2% |
| Interquartile Range (IQR) | 4.1% | 2.4% |
| Standard Deviation (Sample) | 3.3% | 2.0% |
| Standard Deviation (Population) | 3.3% | 2.0% |
Correlation Details
| Assyrian/Chaldean/Syriac Percentile | Sample Size | Married-Couple Family Poverty |
[ 0.0% - 0.5% ] 0.017% | 76,591,466 | 5.5% |
[ 0.0% - 0.5% ] 0.088% | 15,701,925 | 4.7% |
[ 0.0% - 0.5% ] 0.14% | 4,948,758 | 3.5% |
[ 0.0% - 0.5% ] 0.19% | 2,628,801 | 4.0% |
[ 0.0% - 0.5% ] 0.25% | 1,573,709 | 3.8% |
[ 0.0% - 0.5% ] 0.31% | 2,267,515 | 4.1% |
[ 0.0% - 0.5% ] 0.38% | 420,345 | 4.1% |
[ 0.0% - 0.5% ] 0.43% | 708,826 | 3.4% |
[ 0.0% - 0.5% ] 0.49% | 400,239 | 3.2% |
[ 0.5% - 1.0% ] 0.54% | 324,931 | 3.0% |
[ 0.5% - 1.0% ] 0.61% | 218,250 | 3.7% |
[ 0.5% - 1.0% ] 0.65% | 141,562 | 5.0% |
[ 0.5% - 1.0% ] 0.71% | 158,089 | 5.8% |
[ 0.5% - 1.0% ] 0.76% | 100,899 | 3.2% |
[ 0.5% - 1.0% ] 0.83% | 254,310 | 3.7% |
[ 0.5% - 1.0% ] 0.89% | 448,550 | 4.4% |
[ 0.5% - 1.0% ] 0.94% | 357,524 | 4.0% |
[ 1.0% - 1.5% ] 1.01% | 121,482 | 3.6% |
[ 1.0% - 1.5% ] 1.09% | 67,216 | 5.3% |
[ 1.0% - 1.5% ] 1.14% | 55,734 | 4.6% |
[ 1.0% - 1.5% ] 1.20% | 24,044 | 2.1% |
[ 1.0% - 1.5% ] 1.24% | 116,218 | 4.4% |
[ 1.0% - 1.5% ] 1.31% | 56,756 | 2.3% |
[ 1.0% - 1.5% ] 1.34% | 138,765 | 2.1% |
[ 1.0% - 1.5% ] 1.45% | 79,187 | 2.2% |
[ 1.5% - 2.0% ] 1.52% | 106,355 | 2.8% |
[ 1.5% - 2.0% ] 1.64% | 53,590 | 5.0% |
[ 1.5% - 2.0% ] 1.68% | 105,302 | 6.2% |
[ 1.5% - 2.0% ] 1.75% | 24,626 | 8.3% |
[ 1.5% - 2.0% ] 1.82% | 16,823 | 4.5% |
[ 1.5% - 2.0% ] 1.87% | 197,840 | 5.8% |
[ 1.5% - 2.0% ] 1.94% | 37,785 | 2.0% |
[ 2.0% - 2.5% ] 2.10% | 27,827 | 3.8% |
[ 2.0% - 2.5% ] 2.18% | 83,562 | 2.0% |
[ 2.0% - 2.5% ] 2.28% | 33,033 | 3.6% |
[ 2.0% - 2.5% ] 2.46% | 57,042 | 6.8% |
[ 2.5% - 3.0% ] 2.55% | 61,494 | 5.4% |
[ 2.5% - 3.0% ] 2.64% | 4,400 | 2.7% |
[ 2.5% - 3.0% ] 2.68% | 78,068 | 2.8% |
[ 2.5% - 3.0% ] 2.76% | 38,003 | 1.0% |
[ 2.5% - 3.0% ] 2.85% | 3,864 | 4.7% |
[ 2.5% - 3.0% ] 3.00% | 1,567 | 4.4% |
[ 3.0% - 3.5% ] 3.16% | 19,083 | 0.54% |
[ 3.0% - 3.5% ] 3.17% | 14,403 | 6.5% |
[ 3.0% - 3.5% ] 3.32% | 59,225 | 1.9% |
[ 3.0% - 3.5% ] 3.44% | 14,806 | 1.8% |
[ 3.5% - 4.0% ] 3.55% | 23,765 | 2.0% |
[ 3.5% - 4.0% ] 3.87% | 45,266 | 3.5% |
[ 4.0% - 4.5% ] 4.02% | 448 | 1.8% |
[ 4.0% - 4.5% ] 4.29% | 128,151 | 10.9% |
[ 4.0% - 4.5% ] 4.33% | 3,698 | 5.0% |
[ 4.0% - 4.5% ] 4.40% | 96,358 | 4.9% |
[ 4.5% - 5.0% ] 4.69% | 59,775 | 11.2% |
[ 4.5% - 5.0% ] 4.96% | 26,536 | 2.0% |
[ 5.0% - 5.5% ] 5.16% | 4,402 | 2.0% |
[ 5.0% - 5.5% ] 5.23% | 45,937 | 5.2% |
[ 5.0% - 5.5% ] 5.25% | 27,848 | 8.5% |
[ 5.0% - 5.5% ] 5.48% | 67,076 | 5.7% |
[ 5.5% - 6.0% ] 5.56% | 34,004 | 5.0% |
[ 5.5% - 6.0% ] 5.58% | 9,320 | 3.9% |
[ 5.5% - 6.0% ] 5.66% | 29,330 | 5.8% |
[ 5.5% - 6.0% ] 5.91% | 22,152 | 2.8% |
[ 5.5% - 6.0% ] 5.94% | 33,170 | 6.0% |
[ 6.0% - 6.5% ] 6.32% | 2,342 | 5.4% |
[ 6.5% - 7.0% ] 6.60% | 16,742 | 4.3% |
[ 7.0% - 7.5% ] 7.02% | 38,727 | 4.5% |
[ 8.5% - 9.0% ] 8.86% | 4,525 | 3.7% |
[ 9.0% - 9.5% ] 9.27% | 34,921 | 4.1% |
[ 9.5% - 10.0% ] 9.58% | 33,174 | 2.8% |
[ 10.5% - 11.0% ] 10.51% | 21,587 | 4.1% |
[ 11.0% - 11.5% ] 11.00% | 6,018 | 5.2% |
[ 11.0% - 11.5% ] 11.50% | 133,744 | 5.6% |
[ 18.0% - 18.5% ] 18.47% | 43,232 | 8.1% |