Mexican American Indian Married-Couple Family Poverty

COMPARE

Mexican American Indian
Race
Ancestry
AfghanAfricanAlaska NativeAlaskan AthabascanAlbanianAleutAlsatianAmericanApacheArabArapahoArgentineanArmenianAssyrian/Chaldean/SyriacAustralianAustrianBahamianBangladeshiBarbadianBasqueBelgianBelizeanBermudanBhutaneseBlackfeetBolivianBrazilianBritishBritish West IndianBulgarianBurmeseCajunCambodianCanadianCape VerdeanCarpatho RusynCelticCentral AmericanCentral American IndianCherokeeCheyenneChickasawChileanChineseChippewaChoctawColombianColvilleComancheCosta RicanCreeCreekCroatianCrowCubanCypriotCzechCzechoslovakianDanishDelawareDominicanDutchDutch West IndianEastern EuropeanEcuadorianEgyptianEnglishEstonianEthiopianEuropeanFijianFilipinoFinnishFrenchFrench American IndianFrench CanadianGermanGerman RussianGhanaianGreekGuamanian/ChamorroGuatemalanGuyaneseHaitianHmongHonduranHopiHoumaHungarianIcelanderIndian (Asian)IndonesianInupiatIranianIraqiIrishIroquoisIsraeliItalianJamaicanJapaneseJordanianKenyanKiowaKoreanLaotianLatvianLebaneseLiberianLithuanianLumbeeLuxembourgerMacedonianMalaysianMalteseMarshalleseMenomineeMexicanMexican American IndianMongolianMoroccanNative HawaiianNavajoNepaleseNew ZealanderNicaraguanNigerianNorthern EuropeanNorwegianOkinawanOsageOttawaPaiutePakistaniPalestinianPanamanianParaguayanPennsylvania GermanPeruvianPimaPolishPortuguesePotawatomiPuebloPuerto RicanPuget Sound SalishRomanianRussianSalvadoranSamoanScandinavianScotch-IrishScottishSeminoleSenegaleseSerbianShoshoneSierra LeoneanSiouxSlavicSlovakSloveneSomaliSouth AfricanSouth AmericanSouth American IndianSoviet UnionSpaniardSpanishSpanish AmericanSpanish American IndianSri LankanSubsaharan AfricanSudaneseSwedishSwissSyrianTaiwaneseThaiTlingit-HaidaTohono O'OdhamTonganTrinidadian and TobagonianTsimshianTurkishU.S. Virgin IslanderUgandanUkrainianUruguayanUteVenezuelanVietnameseWelshWest IndianYakamaYaquiYugoslavianYumanYup'ikZimbabwean
Immigration
NonimmigrantsImmigrantsAfghanistanAfricaAlbaniaArgentinaArmeniaAsiaAustraliaAustriaBahamasBangladeshBarbadosBelarusBelgiumBelizeBoliviaBosnia and HerzegovinaBrazilBulgariaBurma/MyanmarCabo VerdeCambodiaCameroonCanadaCaribbeanCentral AmericaChileChinaColombiaCongoCosta RicaCroatiaCubaCzechoslovakiaDenmarkDominicaDominican RepublicEastern AfricaEastern AsiaEastern EuropeEcuadorEgyptEl SalvadorEnglandEritreaEthiopiaEuropeFijiFranceGermanyGhanaGreeceGrenadaGuatemalaGuyanaHaitiHondurasHong KongHungaryIndiaIndonesiaIranIraqIrelandIsraelItalyJamaicaJapanJordanKazakhstanKenyaKoreaKuwaitLaosLatin AmericaLatviaLebanonLiberiaLithuaniaMalaysiaMexicoMicronesiaMiddle AfricaMoldovaMoroccoNepalNetherlandsNicaraguaNigeriaNorth AmericaNorth MacedoniaNorthern AfricaNorthern EuropeNorwayOceaniaPakistanPanamaPeruPhilippinesPolandPortugalRomaniaRussiaSaudi ArabiaScotlandSenegalSerbiaSierra LeoneSingaporeSomaliaSouth AfricaSouth AmericaSouth Central AsiaSouth Eastern AsiaSouthern EuropeSpainSri LankaSt. Vincent and the GrenadinesSudanSwedenSwitzerlandSyriaTaiwanThailandTrinidad and TobagoTurkeyUgandaUkraineUruguayUzbekistanVenezuelaVietnamWest IndiesWestern AfricaWestern AsiaWestern EuropeYemenZaireZimbabweAzores
Select to Compare
Race
Ancestry
AfghanAfricanAlaska NativeAlaskan AthabascanAlbanianAleutAlsatianAmericanApacheArabArapahoArgentineanArmenianAssyrian/Chaldean/SyriacAustralianAustrianBahamianBangladeshiBarbadianBasqueBelgianBelizeanBermudanBhutaneseBlackfeetBolivianBrazilianBritishBritish West IndianBulgarianBurmeseCajunCambodianCanadianCape VerdeanCarpatho RusynCelticCentral AmericanCentral American IndianCherokeeCheyenneChickasawChileanChineseChippewaChoctawColombianColvilleComancheCosta RicanCreeCreekCroatianCrowCubanCypriotCzechCzechoslovakianDanishDelawareDominicanDutchDutch West IndianEastern EuropeanEcuadorianEgyptianEnglishEstonianEthiopianEuropeanFijianFilipinoFinnishFrenchFrench American IndianFrench CanadianGermanGerman RussianGhanaianGreekGuamanian/ChamorroGuatemalanGuyaneseHaitianHmongHonduranHopiHoumaHungarianIcelanderIndian (Asian)IndonesianInupiatIranianIraqiIrishIroquoisIsraeliItalianJamaicanJapaneseJordanianKenyanKiowaKoreanLaotianLatvianLebaneseLiberianLithuanianLumbeeLuxembourgerMacedonianMalaysianMalteseMarshalleseMenomineeMexicanMongolianMoroccanNative HawaiianNavajoNepaleseNew ZealanderNicaraguanNigerianNorthern EuropeanNorwegianOkinawanOsageOttawaPaiutePakistaniPalestinianPanamanianParaguayanPennsylvania GermanPeruvianPimaPolishPortuguesePotawatomiPuebloPuerto RicanPuget Sound SalishRomanianRussianSalvadoranSamoanScandinavianScotch-IrishScottishSeminoleSenegaleseSerbianShoshoneSierra LeoneanSiouxSlavicSlovakSloveneSomaliSouth AfricanSouth AmericanSouth American IndianSoviet UnionSpaniardSpanishSpanish AmericanSpanish American IndianSri LankanSubsaharan AfricanSudaneseSwedishSwissSyrianTaiwaneseThaiTlingit-HaidaTohono O'OdhamTonganTrinidadian and TobagonianTsimshianTurkishU.S. Virgin IslanderUgandanUkrainianUruguayanUteVenezuelanVietnameseWelshWest IndianYakamaYaquiYugoslavianYumanYup'ikZimbabwean
Immigration
NonimmigrantsImmigrantsAfghanistanAfricaAlbaniaArgentinaArmeniaAsiaAustraliaAustriaBahamasBangladeshBarbadosBelarusBelgiumBelizeBoliviaBosnia and HerzegovinaBrazilBulgariaBurma/MyanmarCabo VerdeCambodiaCameroonCanadaCaribbeanCentral AmericaChileChinaColombiaCongoCosta RicaCroatiaCubaCzechoslovakiaDenmarkDominicaDominican RepublicEastern AfricaEastern AsiaEastern EuropeEcuadorEgyptEl SalvadorEnglandEritreaEthiopiaEuropeFijiFranceGermanyGhanaGreeceGrenadaGuatemalaGuyanaHaitiHondurasHong KongHungaryIndiaIndonesiaIranIraqIrelandIsraelItalyJamaicaJapanJordanKazakhstanKenyaKoreaKuwaitLaosLatin AmericaLatviaLebanonLiberiaLithuaniaMalaysiaMexicoMicronesiaMiddle AfricaMoldovaMoroccoNepalNetherlandsNicaraguaNigeriaNorth AmericaNorth MacedoniaNorthern AfricaNorthern EuropeNorwayOceaniaPakistanPanamaPeruPhilippinesPolandPortugalRomaniaRussiaSaudi ArabiaScotlandSenegalSerbiaSierra LeoneSingaporeSomaliaSouth AfricaSouth AmericaSouth Central AsiaSouth Eastern AsiaSouthern EuropeSpainSri LankaSt. Vincent and the GrenadinesSudanSwedenSwitzerlandSyriaTaiwanThailandTrinidad and TobagoTurkeyUgandaUkraineUruguayUzbekistanVenezuelaVietnamWest IndiesWestern AfricaWestern AsiaWestern EuropeYemenZaireZimbabweAzores
Married-Couple Family Poverty
Income
Poverty
Unemployment
Labor Participation
Family Structure
Vehicle Availability
Education Level
Disability

Mexican American Indian Married-Couple Family Poverty
Tragic

6.4%
POVERTY | MARRIED-COUPLE FAMILIES
0.0/ 100
METRIC RATING
281st/ 347
METRIC RANK

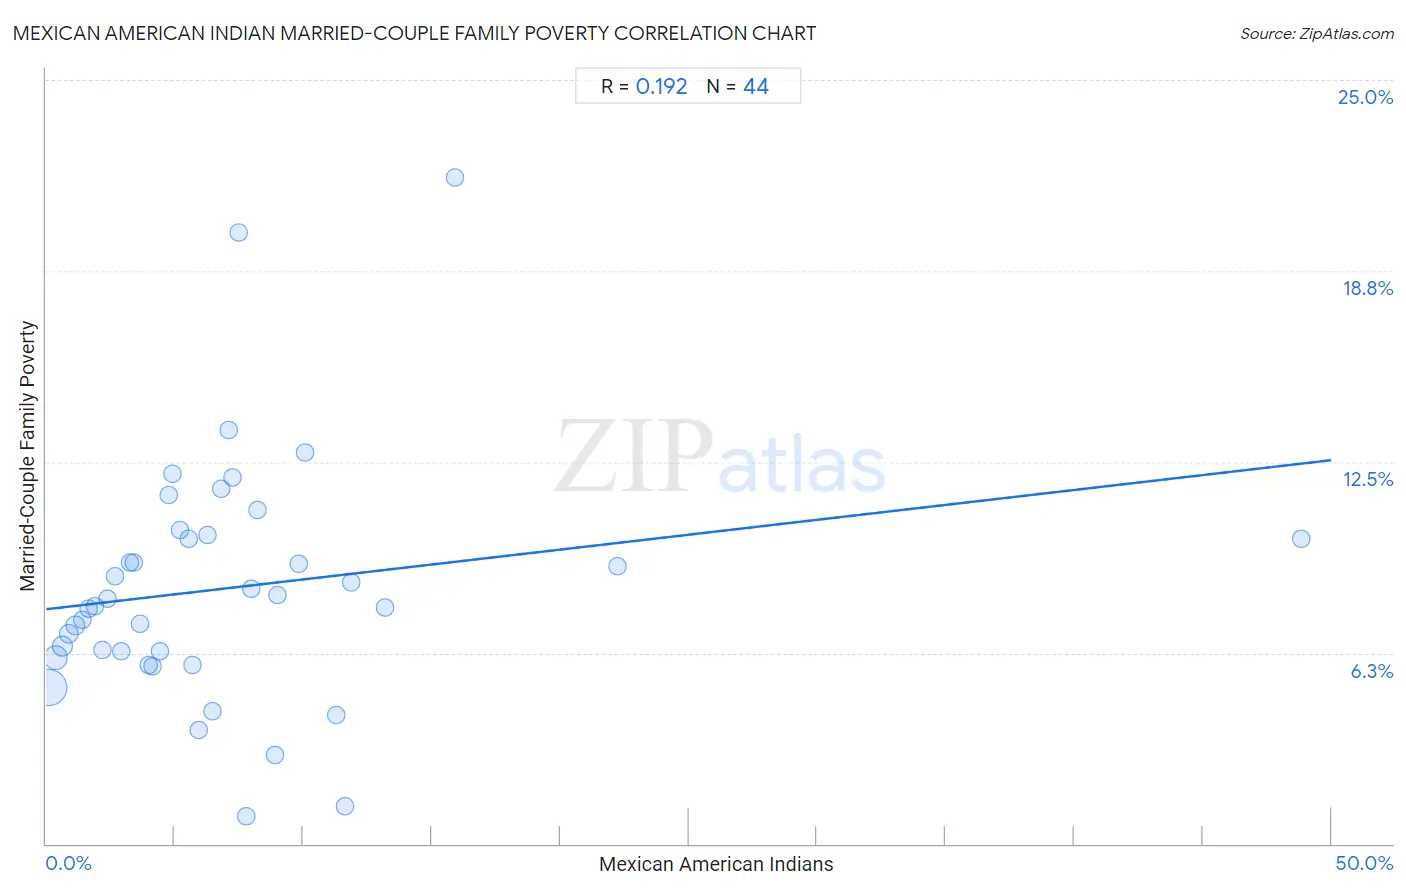
Mexican American Indian Married-Couple Family Poverty Correlation Chart

The statistical analysis conducted on geographies consisting of 316,454,269 people shows a poor positive correlation between the proportion of Mexican American Indians and poverty level among married-couple families in the United States with a correlation coefficient (R) of 0.192 and weighted average of 6.4%. On average, for every 1% (one percent) increase in Mexican American Indians within a typical geography, there is an increase of 0.098% in poverty level among married-couple families.
Mexican American Indian Married-Couple Family Poverty
It is essential to understand that the correlation between the percentage of Mexican American Indians and poverty level among married-couple families does not imply a direct cause-and-effect relationship. It remains uncertain whether the presence of Mexican American Indians influences an upward or downward trend in the level of poverty level among married-couple families within an area, or if Mexican American Indians simply ended up residing in those areas with higher or lower levels of poverty level among married-couple families due to other factors.

Demographics Similar to Mexican American Indians by Married-Couple Family Poverty

In terms of married-couple family poverty, the demographic groups most similar to Mexican American Indians are Seminole (6.4%, a difference of 0.0%), Ute (6.4%, a difference of 0.39%), Dutch West Indian (6.4%, a difference of 0.50%), West Indian (6.4%, a difference of 0.51%), and Houma (6.4%, a difference of 0.56%).
DemographicsRating | RankMarried-Couple Family Poverty
Barbadians
0.1
/100
|
#274
Tragic
6.3%
Choctaw
0.1
/100
|
#275
Tragic
6.3%
Yaqui
0.1
/100
|
#276
Tragic
6.3%
Indonesians
0.1
/100
|
#277
Tragic
6.3%
Immigrants from Trinidad and Tobago
0.1
/100
|
#278
Tragic
6.4%
Houma
0.0
/100
|
#279
Tragic
6.4%
West Indians
0.0
/100
|
#280
Tragic
6.4%
Mexican American Indians
0.0
/100
|
#281
Tragic
6.4%
Seminole
0.0
/100
|
#282
Tragic
6.4%
Ute
0.0
/100
|
#283
Tragic
6.4%
Dutch West Indians
0.0
/100
|
#284
Tragic
6.4%
Blacks/African Americans
0.0
/100
|
#285
Tragic
6.5%
Guyanese
0.0
/100
|
#286
Tragic
6.5%
Ecuadorians
0.0
/100
|
#287
Tragic
6.5%
Salvadorans
0.0
/100
|
#288
Tragic
6.5%

Mexican American Indian Married-Couple Family Poverty Correlation Summary

MeasurementMexican American Indian DataMarried-Couple Family Poverty Data
Minimum0.10%0.88%
Maximum48.8%21.8%
Range48.7%20.9%
Mean7.1%8.4%
Median5.6%7.9%
Interquartile 25% (IQ1)2.8%6.2%
Interquartile 75% (IQ3)8.6%10.0%
Interquartile Range (IQR)5.8%3.9%
Standard Deviation (Sample)7.8%4.0%
Standard Deviation (Population)7.7%3.9%

Correlation Details

Mexican American Indian PercentileSample SizeMarried-Couple Family Poverty
[
0.0%
-
0.5%
]
0.10%
197,080,3315.1%
[
0.0%
-
0.5%
]
0.37%
63,546,3446.1%
[
0.5%
-
1.0%
]
0.62%
27,914,2756.5%
[
0.5%
-
1.0%
]
0.87%
13,465,5846.9%
[
1.0%
-
1.5%
]
1.12%
5,274,8097.2%
[
1.0%
-
1.5%
]
1.39%
2,893,3787.3%
[
1.5%
-
2.0%
]
1.63%
2,366,0357.7%
[
1.5%
-
2.0%
]
1.89%
1,191,6537.8%
[
2.0%
-
2.5%
]
2.17%
901,5036.3%
[
2.0%
-
2.5%
]
2.39%
479,0418.0%
[
2.5%
-
3.0%
]
2.67%
326,7458.7%
[
2.5%
-
3.0%
]
2.93%
106,2926.3%
[
3.0%
-
3.5%
]
3.24%
326,9329.2%
[
3.0%
-
3.5%
]
3.42%
117,3429.2%
[
3.5%
-
4.0%
]
3.65%
102,6827.2%
[
3.5%
-
4.0%
]
3.99%
102,0065.8%
[
4.0%
-
4.5%
]
4.14%
18,4435.8%
[
4.0%
-
4.5%
]
4.43%
30,5046.3%
[
4.5%
-
5.0%
]
4.77%
20,29211.4%
[
4.5%
-
5.0%
]
4.92%
13,42212.1%
[
5.0%
-
5.5%
]
5.19%
35,39310.3%
[
5.5%
-
6.0%
]
5.53%
14,09910.0%
[
5.5%
-
6.0%
]
5.71%
2,5575.9%
[
5.5%
-
6.0%
]
5.91%
18,0793.7%
[
6.0%
-
6.5%
]
6.28%
13,41910.1%
[
6.0%
-
6.5%
]
6.45%
11,4934.3%
[
6.5%
-
7.0%
]
6.80%
7,89311.6%
[
7.0%
-
7.5%
]
7.09%
23,09213.5%
[
7.0%
-
7.5%
]
7.24%
5,16312.0%
[
7.0%
-
7.5%
]
7.49%
2,90920.0%
[
7.5%
-
8.0%
]
7.79%
9,3750.88%
[
7.5%
-
8.0%
]
8.00%
6,8528.3%
[
8.0%
-
8.5%
]
8.24%
6,27410.9%
[
8.5%
-
9.0%
]
8.88%
1,5992.9%
[
9.0%
-
9.5%
]
9.02%
5,4098.2%
[
9.5%
-
10.0%
]
9.83%
8249.1%
[
10.0%
-
10.5%
]
10.05%
4,52612.8%
[
11.0%
-
11.5%
]
11.28%
7274.2%
[
11.5%
-
12.0%
]
11.64%
5071.2%
[
11.5%
-
12.0%
]
11.86%
1,8808.5%
[
13.0%
-
13.5%
]
13.17%
3,2427.7%
[
15.5%
-
16.0%
]
15.93%
1,03621.8%
[
22.0%
-
22.5%
]
22.22%
549.1%
[
48.5%
-
49.0%
]
48.82%
25410.0%