Immigrants from Western Europe Married-Couple Family Poverty
COMPARE
Immigrants from Western Europe
Select to Compare
Married-Couple Family Poverty
Immigrants from Western Europe Married-Couple Family Poverty
4.6%
POVERTY | MARRIED-COUPLE FAMILIES
97.9/ 100
METRIC RATING
100th/ 347
METRIC RANK
Immigrants from Western Europe Married-Couple Family Poverty Correlation Chart
The statistical analysis conducted on geographies consisting of 486,955,315 people shows a substantial positive correlation between the proportion of Immigrants from Western Europe and poverty level among married-couple families in the United States with a correlation coefficient (R) of 0.559 and weighted average of 4.6%. On average, for every 1% (one percent) increase in Immigrants from Western Europe within a typical geography, there is an increase of 0.56% in poverty level among married-couple families.
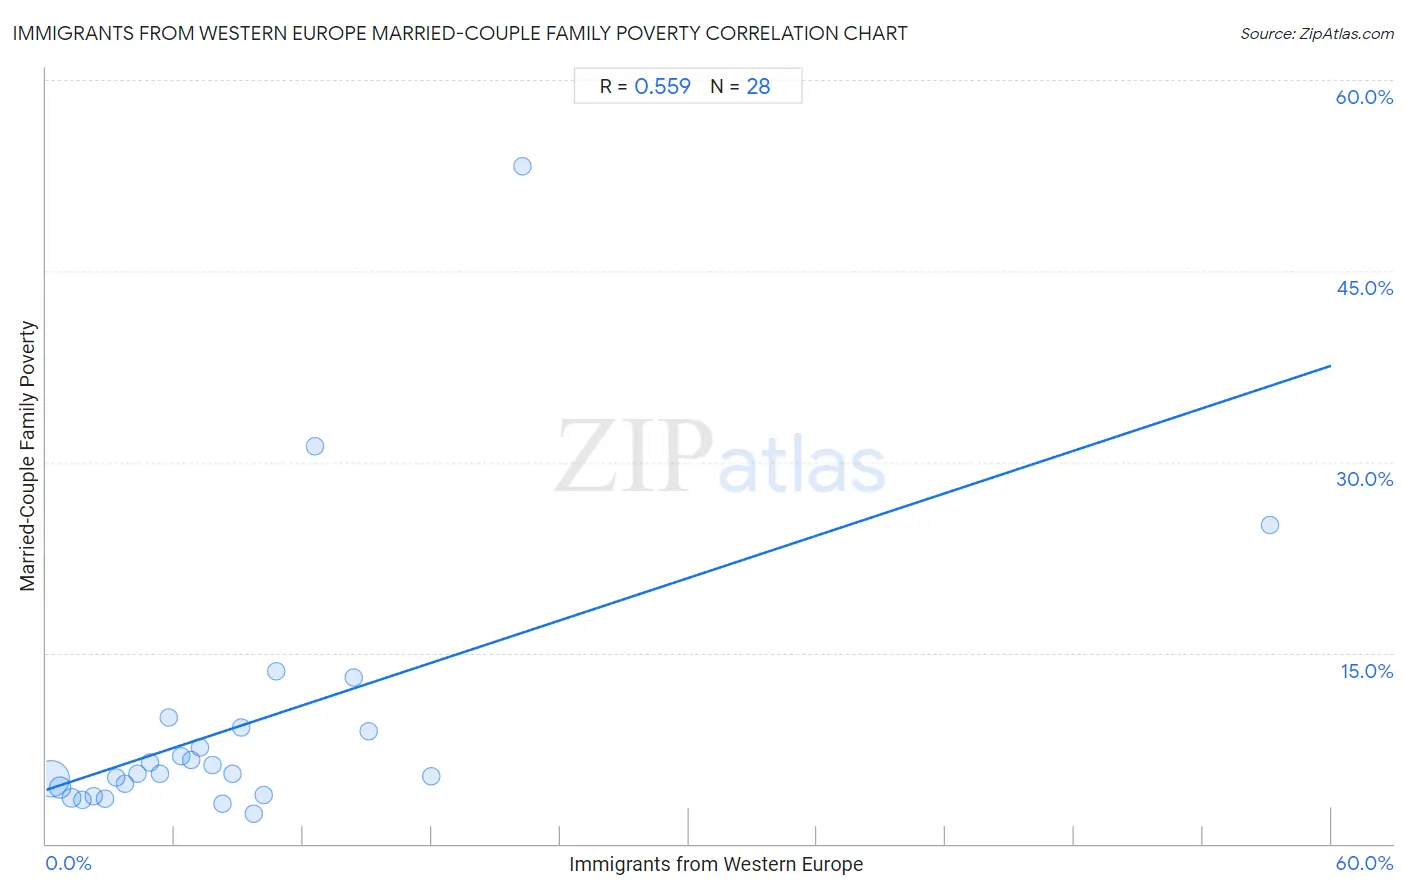
It is essential to understand that the correlation between the percentage of Immigrants from Western Europe and poverty level among married-couple families does not imply a direct cause-and-effect relationship. It remains uncertain whether the presence of Immigrants from Western Europe influences an upward or downward trend in the level of poverty level among married-couple families within an area, or if Immigrants from Western Europe simply ended up residing in those areas with higher or lower levels of poverty level among married-couple families due to other factors.
Demographics Similar to Immigrants from Western Europe by Married-Couple Family Poverty
In terms of married-couple family poverty, the demographic groups most similar to Immigrants from Western Europe are Yugoslavian (4.6%, a difference of 0.020%), Immigrants from Europe (4.6%, a difference of 0.11%), Native Hawaiian (4.6%, a difference of 0.22%), Asian (4.7%, a difference of 0.42%), and Immigrants from Belgium (4.6%, a difference of 0.65%).
| Demographics | Rating | Rank | Married-Couple Family Poverty |
| Koreans | 98.3 /100 | #93 | Exceptional 4.6% |
| Immigrants from Italy | 98.3 /100 | #94 | Exceptional 4.6% |
| Portuguese | 98.3 /100 | #95 | Exceptional 4.6% |
| Immigrants from Poland | 98.3 /100 | #96 | Exceptional 4.6% |
| Immigrants from Belgium | 98.2 /100 | #97 | Exceptional 4.6% |
| Native Hawaiians | 98.0 /100 | #98 | Exceptional 4.6% |
| Immigrants from Europe | 97.9 /100 | #99 | Exceptional 4.6% |
| Immigrants from Western Europe | 97.9 /100 | #100 | Exceptional 4.6% |
| Yugoslavians | 97.8 /100 | #101 | Exceptional 4.6% |
| Asians | 97.6 /100 | #102 | Exceptional 4.7% |
| Immigrants from Romania | 97.3 /100 | #103 | Exceptional 4.7% |
| Immigrants from Moldova | 97.1 /100 | #104 | Exceptional 4.7% |
| Aleuts | 97.0 /100 | #105 | Exceptional 4.7% |
| Immigrants from France | 96.9 /100 | #106 | Exceptional 4.7% |
| Immigrants from Germany | 96.8 /100 | #107 | Exceptional 4.7% |
Immigrants from Western Europe Married-Couple Family Poverty Correlation Summary
| Measurement | Immigrants from Western Europe Data | Married-Couple Family Poverty Data |
| Minimum | 0.21% | 2.3% |
| Maximum | 57.1% | 53.2% |
| Range | 56.9% | 50.9% |
| Mean | 9.3% | 9.4% |
| Median | 7.0% | 5.5% |
| Interquartile 25% (IQ1) | 3.5% | 4.1% |
| Interquartile 75% (IQ3) | 10.5% | 9.0% |
| Interquartile Range (IQR) | 7.0% | 4.9% |
| Standard Deviation (Sample) | 10.8% | 10.7% |
| Standard Deviation (Population) | 10.6% | 10.5% |
Correlation Details
| Immigrants from Western Europe Percentile | Sample Size | Married-Couple Family Poverty |
[ 0.0% - 0.5% ] 0.21% | 392,031,002 | 5.1% |
[ 0.5% - 1.0% ] 0.66% | 75,475,501 | 4.4% |
[ 1.0% - 1.5% ] 1.19% | 12,635,532 | 3.6% |
[ 1.5% - 2.0% ] 1.71% | 3,955,289 | 3.5% |
[ 2.0% - 2.5% ] 2.20% | 1,945,761 | 3.7% |
[ 2.5% - 3.0% ] 2.74% | 524,245 | 3.6% |
[ 3.0% - 3.5% ] 3.27% | 163,710 | 5.2% |
[ 3.5% - 4.0% ] 3.65% | 86,579 | 4.7% |
[ 4.0% - 4.5% ] 4.28% | 40,876 | 5.5% |
[ 4.5% - 5.0% ] 4.82% | 22,529 | 6.4% |
[ 5.0% - 5.5% ] 5.31% | 35,007 | 5.5% |
[ 5.5% - 6.0% ] 5.75% | 2,906 | 9.9% |
[ 6.0% - 6.5% ] 6.31% | 6,590 | 6.9% |
[ 6.5% - 7.0% ] 6.80% | 2,559 | 6.6% |
[ 7.0% - 7.5% ] 7.17% | 9,052 | 7.6% |
[ 7.5% - 8.0% ] 7.74% | 8,040 | 6.2% |
[ 8.0% - 8.5% ] 8.21% | 877 | 3.1% |
[ 8.5% - 9.0% ] 8.68% | 2,004 | 5.5% |
[ 9.0% - 9.5% ] 9.10% | 1,220 | 9.2% |
[ 9.5% - 10.0% ] 9.70% | 2,155 | 2.3% |
[ 10.0% - 10.5% ] 10.18% | 963 | 3.9% |
[ 10.5% - 11.0% ] 10.74% | 242 | 13.5% |
[ 12.5% - 13.0% ] 12.55% | 502 | 31.2% |
[ 14.0% - 14.5% ] 14.35% | 418 | 13.1% |
[ 15.0% - 15.5% ] 15.04% | 838 | 8.9% |
[ 18.0% - 18.5% ] 18.00% | 511 | 5.3% |
[ 22.0% - 22.5% ] 22.26% | 274 | 53.2% |
[ 57.0% - 57.5% ] 57.14% | 133 | 25.0% |