Navajo Married-Couple Family Poverty
COMPARE
Navajo
Select to Compare
Married-Couple Family Poverty
Navajo Married-Couple Family Poverty
11.9%
POVERTY | MARRIED-COUPLE FAMILIES
0.0/ 100
METRIC RATING
344th/ 347
METRIC RANK
Navajo Married-Couple Family Poverty Correlation Chart
The statistical analysis conducted on geographies consisting of 223,988,346 people shows a moderate positive correlation between the proportion of Navajo and poverty level among married-couple families in the United States with a correlation coefficient (R) of 0.482 and weighted average of 11.9%. On average, for every 1% (one percent) increase in Navajo within a typical geography, there is an increase of 0.16% in poverty level among married-couple families.
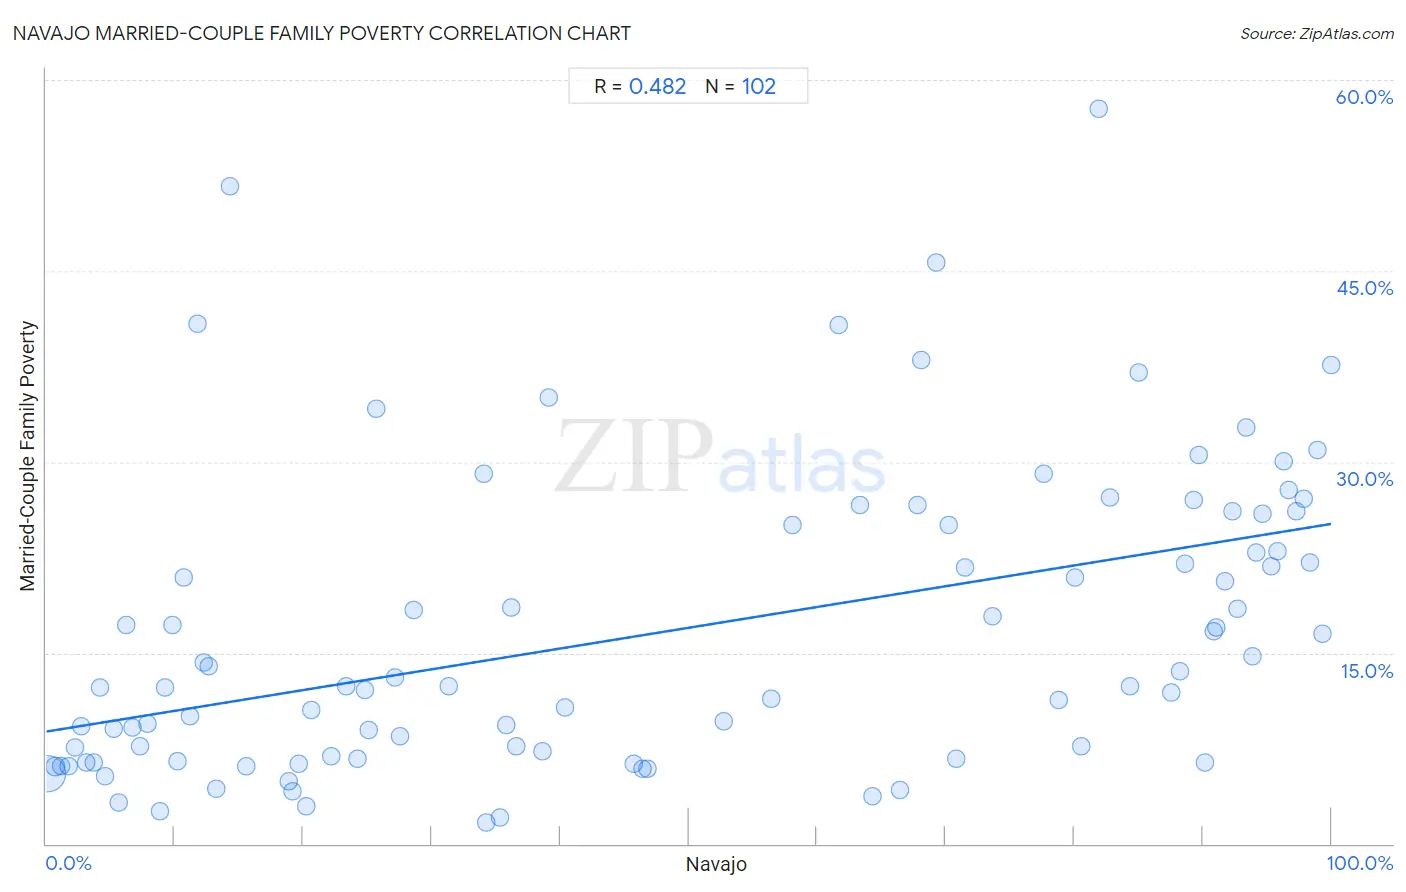
It is essential to understand that the correlation between the percentage of Navajo and poverty level among married-couple families does not imply a direct cause-and-effect relationship. It remains uncertain whether the presence of Navajo influences an upward or downward trend in the level of poverty level among married-couple families within an area, or if Navajo simply ended up residing in those areas with higher or lower levels of poverty level among married-couple families due to other factors.
Demographics Similar to Navajo by Married-Couple Family Poverty
In terms of married-couple family poverty, the demographic groups most similar to Navajo are Pima (11.4%, a difference of 3.9%), Tohono O'odham (11.2%, a difference of 5.6%), Puerto Rican (12.6%, a difference of 6.6%), Pueblo (11.1%, a difference of 6.6%), and Immigrants from Yemen (12.8%, a difference of 8.0%).
| Demographics | Rating | Rank | Married-Couple Family Poverty |
| Lumbee | 0.0 /100 | #333 | Tragic 8.3% |
| Immigrants from Dominican Republic | 0.0 /100 | #334 | Tragic 8.4% |
| Sioux | 0.0 /100 | #335 | Tragic 8.7% |
| Apache | 0.0 /100 | #336 | Tragic 9.0% |
| Yakama | 0.0 /100 | #337 | Tragic 9.0% |
| Cheyenne | 0.0 /100 | #338 | Tragic 9.4% |
| Crow | 0.0 /100 | #339 | Tragic 9.6% |
| Yuman | 0.0 /100 | #340 | Tragic 9.7% |
| Pueblo | 0.0 /100 | #341 | Tragic 11.1% |
| Tohono O'odham | 0.0 /100 | #342 | Tragic 11.2% |
| Pima | 0.0 /100 | #343 | Tragic 11.4% |
| Navajo | 0.0 /100 | #344 | Tragic 11.9% |
| Puerto Ricans | 0.0 /100 | #345 | Tragic 12.6% |
| Immigrants from Yemen | 0.0 /100 | #346 | Tragic 12.8% |
| Yup'ik | 0.0 /100 | #347 | Tragic 13.4% |
Navajo Married-Couple Family Poverty Correlation Summary
| Measurement | Navajo Data | Married-Couple Family Poverty Data |
| Minimum | 0.078% | 1.7% |
| Maximum | 100.0% | 57.8% |
| Range | 99.9% | 56.1% |
| Mean | 48.4% | 16.7% |
| Median | 39.8% | 12.4% |
| Interquartile 25% (IQ1) | 13.2% | 6.7% |
| Interquartile 75% (IQ3) | 85.0% | 25.0% |
| Interquartile Range (IQR) | 71.8% | 18.3% |
| Standard Deviation (Sample) | 35.0% | 11.8% |
| Standard Deviation (Population) | 34.8% | 11.8% |
Correlation Details
| Navajo Percentile | Sample Size | Married-Couple Family Poverty |
[ 0.0% - 0.5% ] 0.078% | 208,435,375 | 5.5% |
[ 0.5% - 1.0% ] 0.71% | 7,534,575 | 6.1% |
[ 1.0% - 1.5% ] 1.15% | 4,135,700 | 6.1% |
[ 1.5% - 2.0% ] 1.72% | 963,465 | 6.1% |
[ 2.0% - 2.5% ] 2.23% | 643,409 | 7.6% |
[ 2.5% - 3.0% ] 2.68% | 279,580 | 9.2% |
[ 3.0% - 3.5% ] 3.11% | 767,907 | 6.3% |
[ 3.5% - 4.0% ] 3.72% | 150,323 | 6.4% |
[ 4.0% - 4.5% ] 4.20% | 101,203 | 12.3% |
[ 4.5% - 5.0% ] 4.56% | 38,617 | 5.3% |
[ 5.0% - 5.5% ] 5.21% | 93,557 | 9.0% |
[ 5.5% - 6.0% ] 5.68% | 30,711 | 3.2% |
[ 6.0% - 6.5% ] 6.26% | 8,499 | 17.2% |
[ 6.5% - 7.0% ] 6.74% | 6,294 | 9.1% |
[ 7.0% - 7.5% ] 7.34% | 5,991 | 7.7% |
[ 7.5% - 8.0% ] 7.89% | 35,804 | 9.5% |
[ 8.5% - 9.0% ] 8.82% | 129,400 | 2.6% |
[ 9.0% - 9.5% ] 9.28% | 4,858 | 12.3% |
[ 9.5% - 10.0% ] 9.81% | 19,204 | 17.2% |
[ 10.0% - 10.5% ] 10.23% | 48,425 | 6.5% |
[ 10.5% - 11.0% ] 10.71% | 1,709 | 20.9% |
[ 11.0% - 11.5% ] 11.21% | 9,287 | 10.0% |
[ 11.5% - 12.0% ] 11.73% | 452 | 40.8% |
[ 12.0% - 12.5% ] 12.28% | 13,859 | 14.2% |
[ 12.5% - 13.0% ] 12.66% | 2,440 | 14.0% |
[ 13.0% - 13.5% ] 13.23% | 3,665 | 4.4% |
[ 14.0% - 14.5% ] 14.29% | 217 | 51.7% |
[ 15.5% - 16.0% ] 15.61% | 6,214 | 6.1% |
[ 18.5% - 19.0% ] 18.89% | 4,488 | 4.9% |
[ 19.0% - 19.5% ] 19.16% | 2,793 | 4.1% |
[ 19.5% - 20.0% ] 19.69% | 3,591 | 6.3% |
[ 20.0% - 20.5% ] 20.22% | 10,362 | 3.0% |
[ 20.5% - 21.0% ] 20.66% | 547 | 10.5% |
[ 22.0% - 22.5% ] 22.14% | 14,980 | 6.9% |
[ 23.0% - 23.5% ] 23.33% | 583 | 12.4% |
[ 24.0% - 24.5% ] 24.25% | 3,345 | 6.7% |
[ 24.5% - 25.0% ] 24.84% | 7,762 | 12.1% |
[ 25.0% - 25.5% ] 25.12% | 3,308 | 8.9% |
[ 25.5% - 26.0% ] 25.63% | 749 | 34.1% |
[ 27.0% - 27.5% ] 27.16% | 4,834 | 13.1% |
[ 27.5% - 28.0% ] 27.52% | 46,457 | 8.5% |
[ 28.5% - 29.0% ] 28.57% | 4,858 | 18.4% |
[ 31.0% - 31.5% ] 31.29% | 46,398 | 12.3% |
[ 34.0% - 34.5% ] 34.00% | 100 | 29.0% |
[ 34.0% - 34.5% ] 34.25% | 5,317 | 1.7% |
[ 35.0% - 35.5% ] 35.30% | 4,842 | 2.1% |
[ 35.5% - 36.0% ] 35.82% | 8,943 | 9.3% |
[ 36.0% - 36.5% ] 36.17% | 188 | 18.5% |
[ 36.5% - 37.0% ] 36.54% | 728 | 7.7% |
[ 38.5% - 39.0% ] 38.63% | 1,504 | 7.3% |
[ 39.0% - 39.5% ] 39.15% | 682 | 35.1% |
[ 40.0% - 40.5% ] 40.35% | 456 | 10.7% |
[ 45.5% - 46.0% ] 45.72% | 9,175 | 6.3% |
[ 46.0% - 46.5% ] 46.35% | 21,672 | 5.9% |
[ 46.5% - 47.0% ] 46.82% | 22,454 | 5.9% |
[ 52.5% - 53.0% ] 52.68% | 16,651 | 9.6% |
[ 56.0% - 56.5% ] 56.43% | 8,855 | 11.4% |
[ 58.0% - 58.5% ] 58.03% | 193 | 25.0% |
[ 61.5% - 62.0% ] 61.69% | 2,665 | 40.8% |
[ 63.0% - 63.5% ] 63.33% | 1,489 | 26.6% |
[ 64.0% - 64.5% ] 64.27% | 10,785 | 3.8% |
[ 66.0% - 66.5% ] 66.44% | 1,612 | 4.2% |
[ 67.5% - 68.0% ] 67.80% | 1,938 | 26.6% |
[ 68.0% - 68.5% ] 68.13% | 5,600 | 38.0% |
[ 69.0% - 69.5% ] 69.30% | 316 | 45.6% |
[ 70.0% - 70.5% ] 70.24% | 1,482 | 25.0% |
[ 70.5% - 71.0% ] 70.81% | 1,552 | 6.6% |
[ 71.0% - 71.5% ] 71.50% | 1,607 | 21.7% |
[ 73.5% - 74.0% ] 73.68% | 494 | 17.9% |
[ 77.5% - 78.0% ] 77.65% | 4,345 | 29.1% |
[ 78.5% - 79.0% ] 78.79% | 11,154 | 11.3% |
[ 80.0% - 80.5% ] 80.04% | 526 | 20.9% |
[ 80.5% - 81.0% ] 80.57% | 211 | 7.7% |
[ 81.5% - 82.0% ] 81.91% | 1,039 | 57.8% |
[ 82.5% - 83.0% ] 82.74% | 2,653 | 27.2% |
[ 84.0% - 84.5% ] 84.30% | 8,372 | 12.4% |
[ 85.0% - 85.5% ] 85.03% | 2,945 | 37.0% |
[ 87.5% - 88.0% ] 87.56% | 868 | 11.9% |
[ 88.0% - 88.5% ] 88.28% | 435 | 13.5% |
[ 88.5% - 89.0% ] 88.60% | 7,238 | 22.0% |
[ 89.0% - 89.5% ] 89.34% | 722 | 27.0% |
[ 89.5% - 90.0% ] 89.73% | 867 | 30.6% |
[ 90.0% - 90.5% ] 90.22% | 2,137 | 6.4% |
[ 90.5% - 91.0% ] 90.84% | 11,403 | 16.7% |
[ 91.0% - 91.5% ] 91.07% | 9,234 | 17.0% |
[ 91.5% - 92.0% ] 91.69% | 8,424 | 20.6% |
[ 92.0% - 92.5% ] 92.32% | 8,246 | 26.1% |
[ 92.5% - 93.0% ] 92.75% | 19,851 | 18.4% |
[ 93.0% - 93.5% ] 93.34% | 3,932 | 32.7% |
[ 93.5% - 94.0% ] 93.92% | 8,846 | 14.7% |
[ 94.0% - 94.5% ] 94.20% | 26,776 | 22.9% |
[ 94.5% - 95.0% ] 94.66% | 6,329 | 25.9% |
[ 95.0% - 95.5% ] 95.37% | 13,459 | 21.8% |
[ 95.5% - 96.0% ] 95.81% | 9,553 | 23.0% |
[ 96.0% - 96.5% ] 96.30% | 6,376 | 30.1% |
[ 96.5% - 97.0% ] 96.72% | 16,594 | 27.8% |
[ 97.0% - 97.5% ] 97.23% | 2,168 | 26.1% |
[ 97.5% - 98.0% ] 97.87% | 9,799 | 27.1% |
[ 98.0% - 98.5% ] 98.34% | 3,915 | 22.1% |
[ 98.5% - 99.0% ] 98.90% | 5,369 | 30.9% |
[ 99.0% - 99.5% ] 99.30% | 10,812 | 16.5% |
[ 99.5% - 100.0% ] 100.00% | 6,653 | 37.6% |