Osage Married-Couple Family Poverty

COMPARE

Osage
Race
Ancestry
AfghanAfricanAlaska NativeAlaskan AthabascanAlbanianAleutAlsatianAmericanApacheArabArapahoArgentineanArmenianAssyrian/Chaldean/SyriacAustralianAustrianBahamianBangladeshiBarbadianBasqueBelgianBelizeanBermudanBhutaneseBlackfeetBolivianBrazilianBritishBritish West IndianBulgarianBurmeseCajunCambodianCanadianCape VerdeanCarpatho RusynCelticCentral AmericanCentral American IndianCherokeeCheyenneChickasawChileanChineseChippewaChoctawColombianColvilleComancheCosta RicanCreeCreekCroatianCrowCubanCypriotCzechCzechoslovakianDanishDelawareDominicanDutchDutch West IndianEastern EuropeanEcuadorianEgyptianEnglishEstonianEthiopianEuropeanFijianFilipinoFinnishFrenchFrench American IndianFrench CanadianGermanGerman RussianGhanaianGreekGuamanian/ChamorroGuatemalanGuyaneseHaitianHmongHonduranHopiHoumaHungarianIcelanderIndian (Asian)IndonesianInupiatIranianIraqiIrishIroquoisIsraeliItalianJamaicanJapaneseJordanianKenyanKiowaKoreanLaotianLatvianLebaneseLiberianLithuanianLumbeeLuxembourgerMacedonianMalaysianMalteseMarshalleseMenomineeMexicanMexican American IndianMongolianMoroccanNative HawaiianNavajoNepaleseNew ZealanderNicaraguanNigerianNorthern EuropeanNorwegianOkinawanOsageOttawaPaiutePakistaniPalestinianPanamanianParaguayanPennsylvania GermanPeruvianPimaPolishPortuguesePotawatomiPuebloPuerto RicanPuget Sound SalishRomanianRussianSalvadoranSamoanScandinavianScotch-IrishScottishSeminoleSenegaleseSerbianShoshoneSierra LeoneanSiouxSlavicSlovakSloveneSomaliSouth AfricanSouth AmericanSouth American IndianSoviet UnionSpaniardSpanishSpanish AmericanSpanish American IndianSri LankanSubsaharan AfricanSudaneseSwedishSwissSyrianTaiwaneseThaiTlingit-HaidaTohono O'OdhamTonganTrinidadian and TobagonianTsimshianTurkishU.S. Virgin IslanderUgandanUkrainianUruguayanUteVenezuelanVietnameseWelshWest IndianYakamaYaquiYugoslavianYumanYup'ikZimbabwean
Immigration
NonimmigrantsImmigrantsAfghanistanAfricaAlbaniaArgentinaArmeniaAsiaAustraliaAustriaBahamasBangladeshBarbadosBelarusBelgiumBelizeBoliviaBosnia and HerzegovinaBrazilBulgariaBurma/MyanmarCabo VerdeCambodiaCameroonCanadaCaribbeanCentral AmericaChileChinaColombiaCongoCosta RicaCroatiaCubaCzechoslovakiaDenmarkDominicaDominican RepublicEastern AfricaEastern AsiaEastern EuropeEcuadorEgyptEl SalvadorEnglandEritreaEthiopiaEuropeFijiFranceGermanyGhanaGreeceGrenadaGuatemalaGuyanaHaitiHondurasHong KongHungaryIndiaIndonesiaIranIraqIrelandIsraelItalyJamaicaJapanJordanKazakhstanKenyaKoreaKuwaitLaosLatin AmericaLatviaLebanonLiberiaLithuaniaMalaysiaMexicoMicronesiaMiddle AfricaMoldovaMoroccoNepalNetherlandsNicaraguaNigeriaNorth AmericaNorth MacedoniaNorthern AfricaNorthern EuropeNorwayOceaniaPakistanPanamaPeruPhilippinesPolandPortugalRomaniaRussiaSaudi ArabiaScotlandSenegalSerbiaSierra LeoneSingaporeSomaliaSouth AfricaSouth AmericaSouth Central AsiaSouth Eastern AsiaSouthern EuropeSpainSri LankaSt. Vincent and the GrenadinesSudanSwedenSwitzerlandSyriaTaiwanThailandTrinidad and TobagoTurkeyUgandaUkraineUruguayUzbekistanVenezuelaVietnamWest IndiesWestern AfricaWestern AsiaWestern EuropeYemenZaireZimbabweAzores
Select to Compare
Race
Ancestry
AfghanAfricanAlaska NativeAlaskan AthabascanAlbanianAleutAlsatianAmericanApacheArabArapahoArgentineanArmenianAssyrian/Chaldean/SyriacAustralianAustrianBahamianBangladeshiBarbadianBasqueBelgianBelizeanBermudanBhutaneseBlackfeetBolivianBrazilianBritishBritish West IndianBulgarianBurmeseCajunCambodianCanadianCape VerdeanCarpatho RusynCelticCentral AmericanCentral American IndianCherokeeCheyenneChickasawChileanChineseChippewaChoctawColombianColvilleComancheCosta RicanCreeCreekCroatianCrowCubanCypriotCzechCzechoslovakianDanishDelawareDominicanDutchDutch West IndianEastern EuropeanEcuadorianEgyptianEnglishEstonianEthiopianEuropeanFijianFilipinoFinnishFrenchFrench American IndianFrench CanadianGermanGerman RussianGhanaianGreekGuamanian/ChamorroGuatemalanGuyaneseHaitianHmongHonduranHopiHoumaHungarianIcelanderIndian (Asian)IndonesianInupiatIranianIraqiIrishIroquoisIsraeliItalianJamaicanJapaneseJordanianKenyanKiowaKoreanLaotianLatvianLebaneseLiberianLithuanianLumbeeLuxembourgerMacedonianMalaysianMalteseMarshalleseMenomineeMexicanMexican American IndianMongolianMoroccanNative HawaiianNavajoNepaleseNew ZealanderNicaraguanNigerianNorthern EuropeanNorwegianOkinawanOttawaPaiutePakistaniPalestinianPanamanianParaguayanPennsylvania GermanPeruvianPimaPolishPortuguesePotawatomiPuebloPuerto RicanPuget Sound SalishRomanianRussianSalvadoranSamoanScandinavianScotch-IrishScottishSeminoleSenegaleseSerbianShoshoneSierra LeoneanSiouxSlavicSlovakSloveneSomaliSouth AfricanSouth AmericanSouth American IndianSoviet UnionSpaniardSpanishSpanish AmericanSpanish American IndianSri LankanSubsaharan AfricanSudaneseSwedishSwissSyrianTaiwaneseThaiTlingit-HaidaTohono O'OdhamTonganTrinidadian and TobagonianTsimshianTurkishU.S. Virgin IslanderUgandanUkrainianUruguayanUteVenezuelanVietnameseWelshWest IndianYakamaYaquiYugoslavianYumanYup'ikZimbabwean
Immigration
NonimmigrantsImmigrantsAfghanistanAfricaAlbaniaArgentinaArmeniaAsiaAustraliaAustriaBahamasBangladeshBarbadosBelarusBelgiumBelizeBoliviaBosnia and HerzegovinaBrazilBulgariaBurma/MyanmarCabo VerdeCambodiaCameroonCanadaCaribbeanCentral AmericaChileChinaColombiaCongoCosta RicaCroatiaCubaCzechoslovakiaDenmarkDominicaDominican RepublicEastern AfricaEastern AsiaEastern EuropeEcuadorEgyptEl SalvadorEnglandEritreaEthiopiaEuropeFijiFranceGermanyGhanaGreeceGrenadaGuatemalaGuyanaHaitiHondurasHong KongHungaryIndiaIndonesiaIranIraqIrelandIsraelItalyJamaicaJapanJordanKazakhstanKenyaKoreaKuwaitLaosLatin AmericaLatviaLebanonLiberiaLithuaniaMalaysiaMexicoMicronesiaMiddle AfricaMoldovaMoroccoNepalNetherlandsNicaraguaNigeriaNorth AmericaNorth MacedoniaNorthern AfricaNorthern EuropeNorwayOceaniaPakistanPanamaPeruPhilippinesPolandPortugalRomaniaRussiaSaudi ArabiaScotlandSenegalSerbiaSierra LeoneSingaporeSomaliaSouth AfricaSouth AmericaSouth Central AsiaSouth Eastern AsiaSouthern EuropeSpainSri LankaSt. Vincent and the GrenadinesSudanSwedenSwitzerlandSyriaTaiwanThailandTrinidad and TobagoTurkeyUgandaUkraineUruguayUzbekistanVenezuelaVietnamWest IndiesWestern AfricaWestern AsiaWestern EuropeYemenZaireZimbabweAzores
Married-Couple Family Poverty
Income
Poverty
Unemployment
Labor Participation
Family Structure
Vehicle Availability
Education Level
Disability

Osage Married-Couple Family Poverty
Excellent

5.1%
POVERTY | MARRIED-COUPLE FAMILIES
87.5/ 100
METRIC RATING
163rd/ 347
METRIC RANK

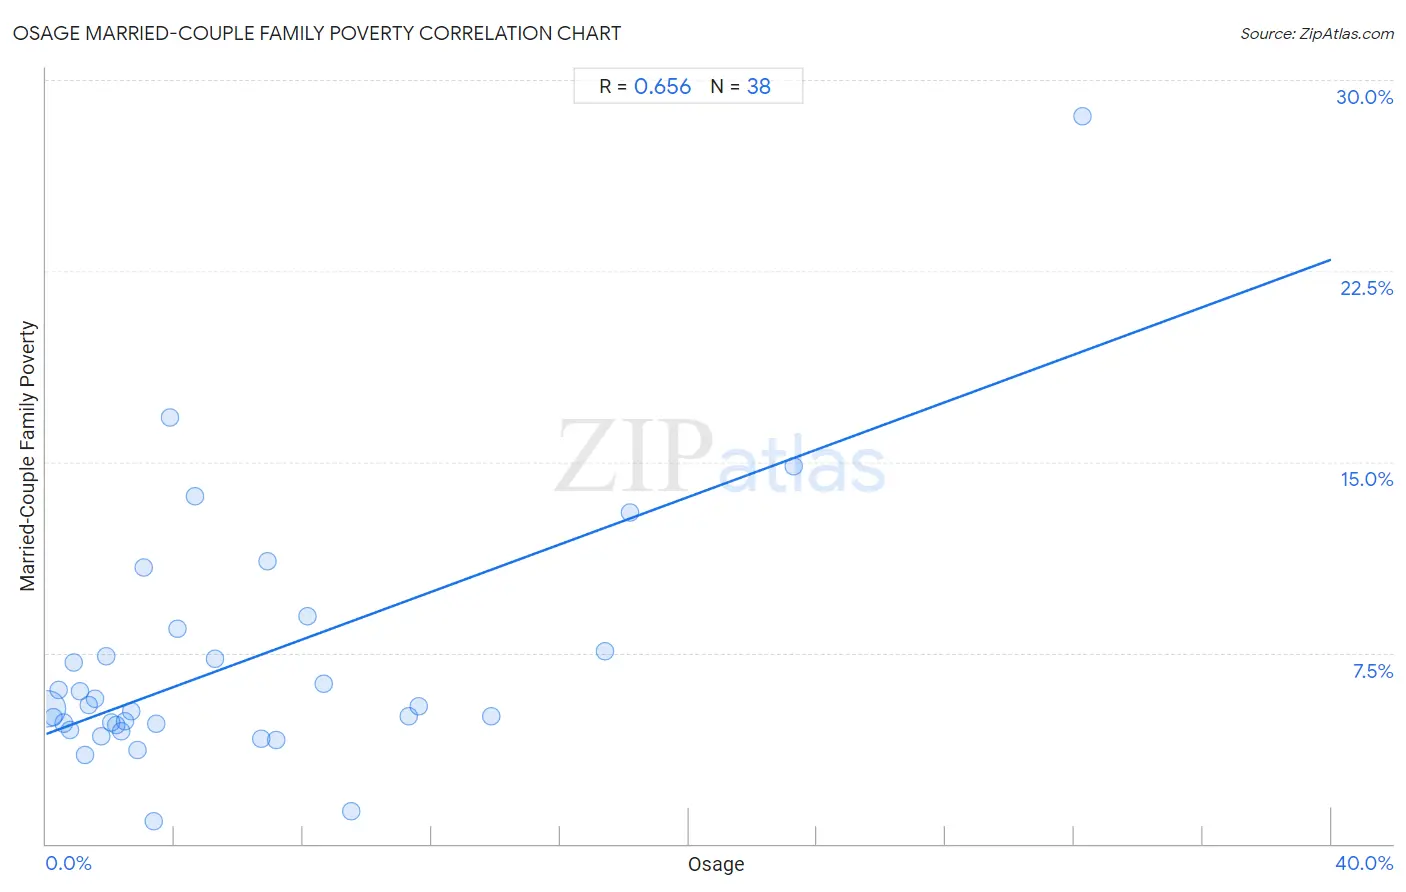
Osage Married-Couple Family Poverty Correlation Chart

The statistical analysis conducted on geographies consisting of 87,073,337 people shows a slight positive correlation between the proportion of Osage and poverty level among married-couple families in the United States with a correlation coefficient (R) of 0.057 and weighted average of 5.1%. On average, for every 1% (one percent) increase in Osage within a typical geography, there is an increase of 0.065% in poverty level among married-couple families.
Osage Married-Couple Family Poverty
It is essential to understand that the correlation between the percentage of Osage and poverty level among married-couple families does not imply a direct cause-and-effect relationship. It remains uncertain whether the presence of Osage influences an upward or downward trend in the level of poverty level among married-couple families within an area, or if Osage simply ended up residing in those areas with higher or lower levels of poverty level among married-couple families due to other factors.

Demographics Similar to Osage by Married-Couple Family Poverty

In terms of married-couple family poverty, the demographic groups most similar to Osage are Soviet Union (5.1%, a difference of 0.0%), Immigrants from Saudi Arabia (5.1%, a difference of 0.010%), Argentinean (5.1%, a difference of 0.15%), Ethiopian (5.2%, a difference of 0.31%), and Hungarian (5.2%, a difference of 0.33%).
DemographicsRating | RankMarried-Couple Family Poverty
Nepalese
88.4
/100
|
#156
Excellent
5.0%
Albanians
88.3
/100
|
#157
Excellent
5.0%
Assyrians/Chaldeans/Syriacs
88.3
/100
|
#158
Excellent
5.0%
Malaysians
88.2
/100
|
#159
Excellent
5.1%
Immigrants from Malaysia
87.9
/100
|
#160
Excellent
5.1%
Argentineans
87.6
/100
|
#161
Excellent
5.1%
Soviet Union
87.5
/100
|
#162
Excellent
5.1%
Osage
87.5
/100
|
#163
Excellent
5.1%
Immigrants from Saudi Arabia
87.5
/100
|
#164
Excellent
5.1%
Ethiopians
87.4
/100
|
#165
Excellent
5.2%
Hungarians
87.4
/100
|
#166
Excellent
5.2%
Immigrants from Uganda
87.4
/100
|
#167
Excellent
5.2%
Chileans
87.4
/100
|
#168
Excellent
5.2%
Immigrants from Ethiopia
87.3
/100
|
#169
Excellent
5.2%
Delaware
87.3
/100
|
#170
Excellent
5.2%

Osage Married-Couple Family Poverty Correlation Summary

MeasurementOsage DataMarried-Couple Family Poverty Data
Minimum0.017%1.0%
Maximum18.2%22.2%
Range18.2%21.2%
Mean4.1%6.3%
Median2.7%4.7%
Interquartile 25% (IQ1)1.3%3.7%
Interquartile 75% (IQ3)5.1%7.9%
Interquartile Range (IQR)3.8%4.2%
Standard Deviation (Sample)4.0%4.6%
Standard Deviation (Population)4.0%4.5%

Correlation Details

Osage PercentileSample SizeMarried-Couple Family Poverty
[
0.0%
-
0.5%
]
0.017%
78,073,9425.5%
[
0.0%
-
0.5%
]
0.12%
4,493,3984.0%
[
0.0%
-
0.5%
]
0.22%
1,920,8135.6%
[
0.0%
-
0.5%
]
0.31%
883,3654.7%
[
0.0%
-
0.5%
]
0.40%
431,1424.8%
[
0.0%
-
0.5%
]
0.50%
398,1784.8%
[
0.5%
-
1.0%
]
0.60%
121,7394.4%
[
0.5%
-
1.0%
]
0.67%
129,3005.8%
[
0.5%
-
1.0%
]
0.77%
104,1876.1%
[
0.5%
-
1.0%
]
0.85%
94,2945.3%
[
0.5%
-
1.0%
]
0.97%
49,9879.0%
[
1.0%
-
1.5%
]
1.06%
123,6726.3%
[
1.0%
-
1.5%
]
1.14%
30,4664.0%
[
1.0%
-
1.5%
]
1.25%
18,9665.1%
[
1.0%
-
1.5%
]
1.31%
13,9337.9%
[
1.0%
-
1.5%
]
1.40%
15,0602.6%
[
1.0%
-
1.5%
]
1.50%
27,9255.2%
[
1.5%
-
2.0%
]
1.58%
12,4431.2%
[
1.5%
-
2.0%
]
1.67%
3,7087.9%
[
1.5%
-
2.0%
]
1.76%
25,6606.1%
[
1.5%
-
2.0%
]
1.87%
4,5559.0%
[
1.5%
-
2.0%
]
1.96%
16,1253.3%
[
2.0%
-
2.5%
]
2.05%
2,24412.4%
[
2.0%
-
2.5%
]
2.16%
7,7912.1%
[
2.0%
-
2.5%
]
2.19%
1,0053.7%
[
2.0%
-
2.5%
]
2.34%
1,36812.4%
[
2.0%
-
2.5%
]
2.39%
3,5214.1%
[
2.5%
-
3.0%
]
2.52%
3,29611.5%
[
2.5%
-
3.0%
]
2.91%
1,4115.0%
[
3.0%
-
3.5%
]
3.05%
5,3831.0%
[
3.0%
-
3.5%
]
3.12%
2,4044.4%
[
3.0%
-
3.5%
]
3.19%
18818.8%
[
3.0%
-
3.5%
]
3.29%
3954.5%
[
3.0%
-
3.5%
]
3.45%
5820.0%
[
3.5%
-
4.0%
]
3.59%
5572.0%
[
3.5%
-
4.0%
]
3.69%
2982.0%
[
3.5%
-
4.0%
]
3.94%
7863.2%
[
4.0%
-
4.5%
]
4.06%
3209.6%
[
4.0%
-
4.5%
]
4.39%
9114.0%
[
4.5%
-
5.0%
]
4.55%
8804.1%
[
4.5%
-
5.0%
]
4.72%
15,1804.4%
[
4.5%
-
5.0%
]
4.74%
27412.3%
[
5.0%
-
5.5%
]
5.47%
3843.7%
[
6.5%
-
7.0%
]
6.55%
8,3967.0%
[
6.5%
-
7.0%
]
6.79%
1,2233.1%
[
7.0%
-
7.5%
]
7.44%
12122.2%
[
7.5%
-
8.0%
]
7.84%
10215.0%
[
8.5%
-
9.0%
]
8.96%
3,3142.9%
[
9.0%
-
9.5%
]
9.24%
4,1992.0%
[
9.5%
-
10.0%
]
9.72%
3,0664.5%
[
9.5%
-
10.0%
]
9.82%
5,0334.1%
[
10.0%
-
10.5%
]
10.03%
1,9041.7%
[
11.5%
-
12.0%
]
11.85%
5409.6%
[
13.5%
-
14.0%
]
13.64%
884.0%
[
13.5%
-
14.0%
]
13.90%
1,0073.6%
[
18.0%
-
18.5%
]
18.19%
2,8329.7%