Immigrants from Australia Married-Couple Family Poverty
COMPARE
Immigrants from Australia
Select to Compare
Married-Couple Family Poverty
Immigrants from Australia Married-Couple Family Poverty
4.4%
POVERTY | MARRIED-COUPLE FAMILIES
99.6/ 100
METRIC RATING
62nd/ 347
METRIC RANK
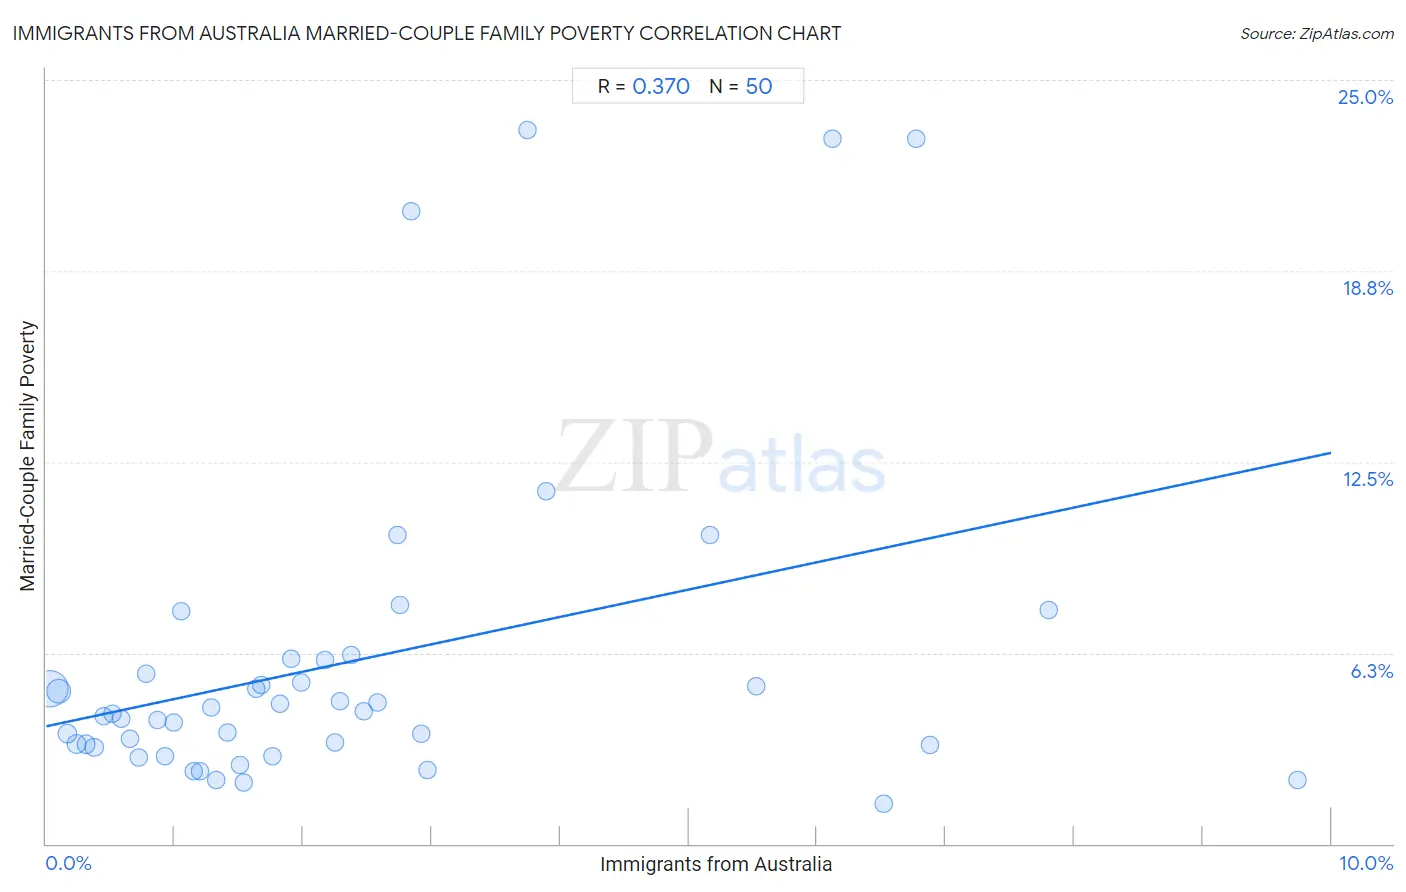
Immigrants from Australia Married-Couple Family Poverty Correlation Chart
The statistical analysis conducted on geographies consisting of 225,813,318 people shows a mild positive correlation between the proportion of Immigrants from Australia and poverty level among married-couple families in the United States with a correlation coefficient (R) of 0.370 and weighted average of 4.4%. On average, for every 1% (one percent) increase in Immigrants from Australia within a typical geography, there is an increase of 0.89% in poverty level among married-couple families.
It is essential to understand that the correlation between the percentage of Immigrants from Australia and poverty level among married-couple families does not imply a direct cause-and-effect relationship. It remains uncertain whether the presence of Immigrants from Australia influences an upward or downward trend in the level of poverty level among married-couple families within an area, or if Immigrants from Australia simply ended up residing in those areas with higher or lower levels of poverty level among married-couple families due to other factors.
Demographics Similar to Immigrants from Australia by Married-Couple Family Poverty
In terms of married-couple family poverty, the demographic groups most similar to Immigrants from Australia are Okinawan (4.4%, a difference of 0.010%), Tlingit-Haida (4.4%, a difference of 0.12%), Immigrants from Sweden (4.4%, a difference of 0.19%), Immigrants from Sri Lanka (4.4%, a difference of 0.36%), and Czechoslovakian (4.4%, a difference of 0.74%).
| Demographics | Rating | Rank | Married-Couple Family Poverty |
| French | 99.7 /100 | #55 | Exceptional 4.3% |
| Immigrants from Zimbabwe | 99.7 /100 | #56 | Exceptional 4.3% |
| Immigrants from Netherlands | 99.7 /100 | #57 | Exceptional 4.3% |
| Czechoslovakians | 99.7 /100 | #58 | Exceptional 4.4% |
| Immigrants from Sweden | 99.6 /100 | #59 | Exceptional 4.4% |
| Tlingit-Haida | 99.6 /100 | #60 | Exceptional 4.4% |
| Okinawans | 99.6 /100 | #61 | Exceptional 4.4% |
| Immigrants from Australia | 99.6 /100 | #62 | Exceptional 4.4% |
| Immigrants from Sri Lanka | 99.6 /100 | #63 | Exceptional 4.4% |
| Immigrants from Bulgaria | 99.5 /100 | #64 | Exceptional 4.4% |
| Macedonians | 99.4 /100 | #65 | Exceptional 4.4% |
| Immigrants from Serbia | 99.4 /100 | #66 | Exceptional 4.4% |
| Immigrants from Canada | 99.4 /100 | #67 | Exceptional 4.4% |
| Slavs | 99.4 /100 | #68 | Exceptional 4.4% |
| New Zealanders | 99.4 /100 | #69 | Exceptional 4.4% |
Immigrants from Australia Married-Couple Family Poverty Correlation Summary
| Measurement | Immigrants from Australia Data | Married-Couple Family Poverty Data |
| Minimum | 0.030% | 1.3% |
| Maximum | 9.7% | 23.4% |
| Range | 9.7% | 22.1% |
| Mean | 2.4% | 6.0% |
| Median | 1.7% | 4.3% |
| Interquartile 25% (IQ1) | 0.87% | 3.2% |
| Interquartile 75% (IQ3) | 2.8% | 6.0% |
| Interquartile Range (IQR) | 2.0% | 2.8% |
| Standard Deviation (Sample) | 2.2% | 5.4% |
| Standard Deviation (Population) | 2.2% | 5.3% |
Correlation Details
| Immigrants from Australia Percentile | Sample Size | Married-Couple Family Poverty |
[ 0.0% - 0.5% ] 0.030% | 148,000,685 | 5.1% |
[ 0.0% - 0.5% ] 0.099% | 49,925,760 | 5.0% |
[ 0.0% - 0.5% ] 0.16% | 11,991,771 | 3.6% |
[ 0.0% - 0.5% ] 0.24% | 6,217,209 | 3.3% |
[ 0.0% - 0.5% ] 0.31% | 2,699,790 | 3.3% |
[ 0.0% - 0.5% ] 0.37% | 2,484,069 | 3.2% |
[ 0.0% - 0.5% ] 0.44% | 1,269,761 | 4.2% |
[ 0.5% - 1.0% ] 0.51% | 1,008,885 | 4.3% |
[ 0.5% - 1.0% ] 0.58% | 764,302 | 4.1% |
[ 0.5% - 1.0% ] 0.66% | 330,823 | 3.5% |
[ 0.5% - 1.0% ] 0.72% | 182,258 | 2.8% |
[ 0.5% - 1.0% ] 0.78% | 266,970 | 5.6% |
[ 0.5% - 1.0% ] 0.87% | 90,886 | 4.1% |
[ 0.5% - 1.0% ] 0.92% | 104,485 | 2.9% |
[ 0.5% - 1.0% ] 0.99% | 60,417 | 4.0% |
[ 1.0% - 1.5% ] 1.05% | 15,962 | 7.6% |
[ 1.0% - 1.5% ] 1.15% | 88,462 | 2.4% |
[ 1.0% - 1.5% ] 1.20% | 80,891 | 2.4% |
[ 1.0% - 1.5% ] 1.28% | 37,667 | 4.5% |
[ 1.0% - 1.5% ] 1.32% | 35,729 | 2.1% |
[ 1.0% - 1.5% ] 1.41% | 9,928 | 3.6% |
[ 1.5% - 2.0% ] 1.50% | 35,234 | 2.6% |
[ 1.5% - 2.0% ] 1.54% | 2,209 | 2.0% |
[ 1.5% - 2.0% ] 1.63% | 7,542 | 5.1% |
[ 1.5% - 2.0% ] 1.67% | 1,971 | 5.2% |
[ 1.5% - 2.0% ] 1.76% | 5,105 | 2.8% |
[ 1.5% - 2.0% ] 1.82% | 28,699 | 4.6% |
[ 1.5% - 2.0% ] 1.91% | 5,402 | 6.0% |
[ 1.5% - 2.0% ] 1.99% | 1,963 | 5.3% |
[ 2.0% - 2.5% ] 2.17% | 3,276 | 6.0% |
[ 2.0% - 2.5% ] 2.25% | 5,553 | 3.3% |
[ 2.0% - 2.5% ] 2.28% | 2,191 | 4.7% |
[ 2.0% - 2.5% ] 2.37% | 8,061 | 6.2% |
[ 2.0% - 2.5% ] 2.47% | 4,136 | 4.3% |
[ 2.5% - 3.0% ] 2.57% | 2,175 | 4.6% |
[ 2.5% - 3.0% ] 2.74% | 14,578 | 10.1% |
[ 2.5% - 3.0% ] 2.75% | 1,491 | 7.8% |
[ 2.5% - 3.0% ] 2.84% | 211 | 20.7% |
[ 2.5% - 3.0% ] 2.92% | 10,274 | 3.6% |
[ 2.5% - 3.0% ] 2.97% | 1,381 | 2.4% |
[ 3.5% - 4.0% ] 3.75% | 774 | 23.4% |
[ 3.5% - 4.0% ] 3.89% | 180 | 11.5% |
[ 5.0% - 5.5% ] 5.16% | 310 | 10.1% |
[ 5.5% - 6.0% ] 5.52% | 326 | 5.2% |
[ 6.0% - 6.5% ] 6.12% | 147 | 23.1% |
[ 6.5% - 7.0% ] 6.51% | 614 | 1.3% |
[ 6.5% - 7.0% ] 6.77% | 133 | 23.1% |
[ 6.5% - 7.0% ] 6.88% | 800 | 3.2% |
[ 7.5% - 8.0% ] 7.80% | 1,307 | 7.6% |
[ 9.5% - 10.0% ] 9.73% | 565 | 2.1% |