Immigrants from Jordan Married-Couple Family Poverty
COMPARE
Immigrants from Jordan
Select to Compare
Married-Couple Family Poverty
Immigrants from Jordan Married-Couple Family Poverty
5.1%
POVERTY | MARRIED-COUPLE FAMILIES
66.5/ 100
METRIC RATING
162nd/ 347
METRIC RANK
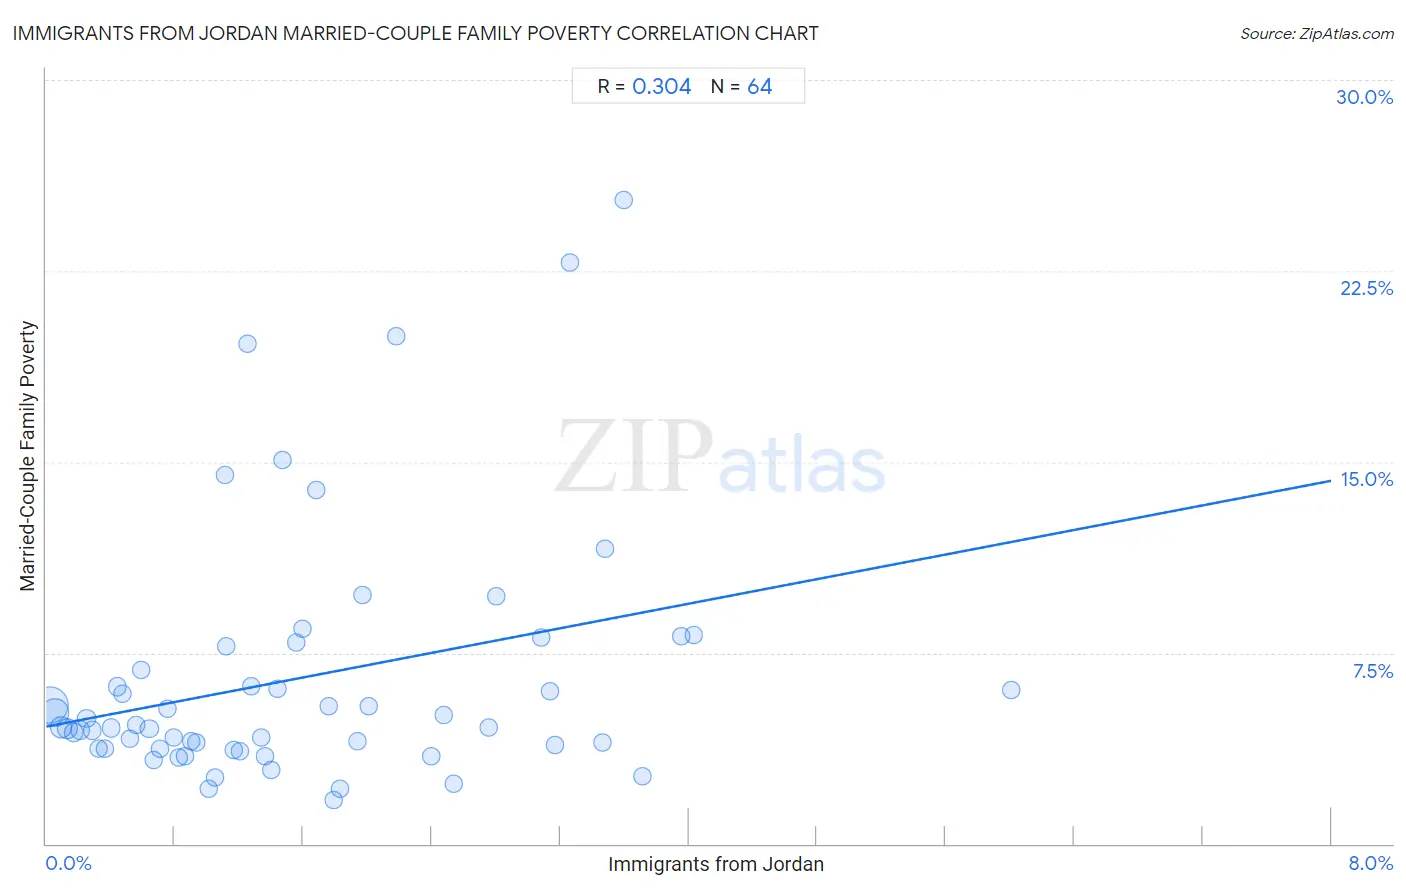
Immigrants from Jordan Married-Couple Family Poverty Correlation Chart
The statistical analysis conducted on geographies consisting of 180,872,287 people shows a mild positive correlation between the proportion of Immigrants from Jordan and poverty level among married-couple families in the United States with a correlation coefficient (R) of 0.304 and weighted average of 5.1%. On average, for every 1% (one percent) increase in Immigrants from Jordan within a typical geography, there is an increase of 1.2% in poverty level among married-couple families.
It is essential to understand that the correlation between the percentage of Immigrants from Jordan and poverty level among married-couple families does not imply a direct cause-and-effect relationship. It remains uncertain whether the presence of Immigrants from Jordan influences an upward or downward trend in the level of poverty level among married-couple families within an area, or if Immigrants from Jordan simply ended up residing in those areas with higher or lower levels of poverty level among married-couple families due to other factors.
Demographics Similar to Immigrants from Jordan by Married-Couple Family Poverty
In terms of married-couple family poverty, the demographic groups most similar to Immigrants from Jordan are Ethiopian (5.1%, a difference of 0.22%), Pennsylvania German (5.1%, a difference of 0.27%), Sierra Leonean (5.1%, a difference of 0.31%), Immigrants from South Eastern Asia (5.1%, a difference of 0.53%), and Immigrants from Saudi Arabia (5.1%, a difference of 0.53%).
| Demographics | Rating | Rank | Married-Couple Family Poverty |
| Immigrants from Ethiopia | 72.4 /100 | #155 | Good 5.1% |
| Sri Lankans | 72.2 /100 | #156 | Good 5.1% |
| Argentineans | 70.7 /100 | #157 | Good 5.1% |
| Immigrants from South Eastern Asia | 70.4 /100 | #158 | Good 5.1% |
| Immigrants from Saudi Arabia | 70.3 /100 | #159 | Good 5.1% |
| Pennsylvania Germans | 68.5 /100 | #160 | Good 5.1% |
| Ethiopians | 68.1 /100 | #161 | Good 5.1% |
| Immigrants from Jordan | 66.5 /100 | #162 | Good 5.1% |
| Sierra Leoneans | 64.1 /100 | #163 | Good 5.1% |
| Hawaiians | 62.3 /100 | #164 | Good 5.1% |
| Immigrants from Malaysia | 62.2 /100 | #165 | Good 5.1% |
| Paraguayans | 61.5 /100 | #166 | Good 5.1% |
| Costa Ricans | 61.5 /100 | #167 | Good 5.1% |
| Immigrants from Uganda | 54.9 /100 | #168 | Average 5.2% |
| Ottawa | 54.5 /100 | #169 | Average 5.2% |
Immigrants from Jordan Married-Couple Family Poverty Correlation Summary
| Measurement | Immigrants from Jordan Data | Married-Couple Family Poverty Data |
| Minimum | 0.021% | 1.7% |
| Maximum | 6.0% | 25.3% |
| Range | 6.0% | 23.5% |
| Mean | 1.6% | 6.5% |
| Median | 1.3% | 4.6% |
| Interquartile 25% (IQ1) | 0.62% | 3.7% |
| Interquartile 75% (IQ3) | 2.3% | 7.3% |
| Interquartile Range (IQR) | 1.7% | 3.5% |
| Standard Deviation (Sample) | 1.2% | 4.9% |
| Standard Deviation (Population) | 1.2% | 4.9% |
Correlation Details
| Immigrants from Jordan Percentile | Sample Size | Married-Couple Family Poverty |
[ 0.0% - 0.5% ] 0.021% | 83,069,791 | 5.5% |
[ 0.0% - 0.5% ] 0.057% | 44,483,697 | 5.2% |
[ 0.0% - 0.5% ] 0.094% | 18,124,788 | 4.6% |
[ 0.0% - 0.5% ] 0.13% | 11,951,660 | 4.5% |
[ 0.0% - 0.5% ] 0.17% | 5,996,299 | 4.4% |
[ 0.0% - 0.5% ] 0.21% | 3,648,709 | 4.5% |
[ 0.0% - 0.5% ] 0.25% | 2,744,661 | 4.9% |
[ 0.0% - 0.5% ] 0.29% | 2,115,414 | 4.5% |
[ 0.0% - 0.5% ] 0.33% | 1,197,040 | 3.7% |
[ 0.0% - 0.5% ] 0.36% | 1,130,419 | 3.7% |
[ 0.0% - 0.5% ] 0.40% | 785,010 | 4.5% |
[ 0.0% - 0.5% ] 0.44% | 1,236,433 | 6.2% |
[ 0.0% - 0.5% ] 0.48% | 330,245 | 5.9% |
[ 0.5% - 1.0% ] 0.52% | 457,346 | 4.1% |
[ 0.5% - 1.0% ] 0.56% | 422,672 | 4.7% |
[ 0.5% - 1.0% ] 0.59% | 420,056 | 6.8% |
[ 0.5% - 1.0% ] 0.64% | 357,987 | 4.5% |
[ 0.5% - 1.0% ] 0.67% | 276,118 | 3.3% |
[ 0.5% - 1.0% ] 0.71% | 142,234 | 3.7% |
[ 0.5% - 1.0% ] 0.75% | 259,784 | 5.3% |
[ 0.5% - 1.0% ] 0.79% | 164,724 | 4.2% |
[ 0.5% - 1.0% ] 0.83% | 48,630 | 3.4% |
[ 0.5% - 1.0% ] 0.86% | 107,328 | 3.5% |
[ 0.5% - 1.0% ] 0.90% | 174,021 | 4.0% |
[ 0.5% - 1.0% ] 0.93% | 85,562 | 4.0% |
[ 1.0% - 1.5% ] 1.01% | 72,913 | 2.2% |
[ 1.0% - 1.5% ] 1.05% | 8,728 | 2.6% |
[ 1.0% - 1.5% ] 1.11% | 138,607 | 14.5% |
[ 1.0% - 1.5% ] 1.12% | 81,943 | 7.7% |
[ 1.0% - 1.5% ] 1.17% | 52,627 | 3.7% |
[ 1.0% - 1.5% ] 1.21% | 91,203 | 3.6% |
[ 1.0% - 1.5% ] 1.25% | 83,024 | 19.6% |
[ 1.0% - 1.5% ] 1.28% | 64,439 | 6.2% |
[ 1.0% - 1.5% ] 1.33% | 44,281 | 4.2% |
[ 1.0% - 1.5% ] 1.36% | 37,601 | 3.5% |
[ 1.0% - 1.5% ] 1.40% | 54,590 | 2.9% |
[ 1.0% - 1.5% ] 1.44% | 26,616 | 6.1% |
[ 1.0% - 1.5% ] 1.47% | 14,360 | 15.1% |
[ 1.5% - 2.0% ] 1.56% | 8,220 | 7.9% |
[ 1.5% - 2.0% ] 1.59% | 36,930 | 8.4% |
[ 1.5% - 2.0% ] 1.68% | 12,525 | 13.9% |
[ 1.5% - 2.0% ] 1.76% | 16,613 | 5.4% |
[ 1.5% - 2.0% ] 1.79% | 50,647 | 1.7% |
[ 1.5% - 2.0% ] 1.83% | 25,489 | 2.2% |
[ 1.5% - 2.0% ] 1.94% | 21,760 | 4.0% |
[ 1.5% - 2.0% ] 1.97% | 6,496 | 9.8% |
[ 2.0% - 2.5% ] 2.01% | 14,915 | 5.4% |
[ 2.0% - 2.5% ] 2.18% | 2,160 | 19.9% |
[ 2.0% - 2.5% ] 2.40% | 8,171 | 3.4% |
[ 2.0% - 2.5% ] 2.47% | 7,763 | 5.0% |
[ 2.5% - 3.0% ] 2.54% | 13,291 | 2.3% |
[ 2.5% - 3.0% ] 2.76% | 15,452 | 4.5% |
[ 2.5% - 3.0% ] 2.80% | 9,960 | 9.7% |
[ 3.0% - 3.5% ] 3.08% | 29,883 | 8.1% |
[ 3.0% - 3.5% ] 3.14% | 3,317 | 6.0% |
[ 3.0% - 3.5% ] 3.16% | 8,535 | 3.9% |
[ 3.0% - 3.5% ] 3.26% | 889 | 22.8% |
[ 3.0% - 3.5% ] 3.46% | 7,804 | 4.0% |
[ 3.0% - 3.5% ] 3.48% | 28,568 | 11.6% |
[ 3.5% - 4.0% ] 3.60% | 8,919 | 25.3% |
[ 3.5% - 4.0% ] 3.71% | 2,453 | 2.7% |
[ 3.5% - 4.0% ] 3.95% | 11,084 | 8.2% |
[ 4.0% - 4.5% ] 4.03% | 10,859 | 8.2% |
[ 6.0% - 6.5% ] 6.01% | 8,024 | 6.0% |