Lithuanian Married-Couple Family Poverty

COMPARE

Lithuanian
Race
Ancestry
AfghanAfricanAlaska NativeAlaskan AthabascanAlbanianAleutAlsatianAmericanApacheArabArapahoArgentineanArmenianAssyrian/Chaldean/SyriacAustralianAustrianBahamianBangladeshiBarbadianBasqueBelgianBelizeanBermudanBhutaneseBlackfeetBolivianBrazilianBritishBritish West IndianBulgarianBurmeseCajunCambodianCanadianCape VerdeanCarpatho RusynCelticCentral AmericanCentral American IndianCherokeeCheyenneChickasawChileanChineseChippewaChoctawColombianColvilleComancheCosta RicanCreeCreekCroatianCrowCubanCypriotCzechCzechoslovakianDanishDelawareDominicanDutchDutch West IndianEastern EuropeanEcuadorianEgyptianEnglishEstonianEthiopianEuropeanFijianFilipinoFinnishFrenchFrench American IndianFrench CanadianGermanGerman RussianGhanaianGreekGuamanian/ChamorroGuatemalanGuyaneseHaitianHmongHonduranHopiHoumaHungarianIcelanderIndian (Asian)IndonesianInupiatIranianIraqiIrishIroquoisIsraeliItalianJamaicanJapaneseJordanianKenyanKiowaKoreanLaotianLatvianLebaneseLiberianLithuanianLumbeeLuxembourgerMacedonianMalaysianMalteseMarshalleseMenomineeMexicanMexican American IndianMongolianMoroccanNative HawaiianNavajoNepaleseNew ZealanderNicaraguanNigerianNorthern EuropeanNorwegianOkinawanOsageOttawaPaiutePakistaniPalestinianPanamanianParaguayanPennsylvania GermanPeruvianPimaPolishPortuguesePotawatomiPuebloPuerto RicanPuget Sound SalishRomanianRussianSalvadoranSamoanScandinavianScotch-IrishScottishSeminoleSenegaleseSerbianShoshoneSierra LeoneanSiouxSlavicSlovakSloveneSomaliSouth AfricanSouth AmericanSouth American IndianSoviet UnionSpaniardSpanishSpanish AmericanSpanish American IndianSri LankanSubsaharan AfricanSudaneseSwedishSwissSyrianTaiwaneseThaiTlingit-HaidaTohono O'OdhamTonganTrinidadian and TobagonianTsimshianTurkishU.S. Virgin IslanderUgandanUkrainianUruguayanUteVenezuelanVietnameseWelshWest IndianYakamaYaquiYugoslavianYumanYup'ikZimbabwean
Immigration
NonimmigrantsImmigrantsAfghanistanAfricaAlbaniaArgentinaArmeniaAsiaAustraliaAustriaBahamasBangladeshBarbadosBelarusBelgiumBelizeBoliviaBosnia and HerzegovinaBrazilBulgariaBurma/MyanmarCabo VerdeCambodiaCameroonCanadaCaribbeanCentral AmericaChileChinaColombiaCongoCosta RicaCroatiaCubaCzechoslovakiaDenmarkDominicaDominican RepublicEastern AfricaEastern AsiaEastern EuropeEcuadorEgyptEl SalvadorEnglandEritreaEthiopiaEuropeFijiFranceGermanyGhanaGreeceGrenadaGuatemalaGuyanaHaitiHondurasHong KongHungaryIndiaIndonesiaIranIraqIrelandIsraelItalyJamaicaJapanJordanKazakhstanKenyaKoreaKuwaitLaosLatin AmericaLatviaLebanonLiberiaLithuaniaMalaysiaMexicoMicronesiaMiddle AfricaMoldovaMoroccoNepalNetherlandsNicaraguaNigeriaNorth AmericaNorth MacedoniaNorthern AfricaNorthern EuropeNorwayOceaniaPakistanPanamaPeruPhilippinesPolandPortugalRomaniaRussiaSaudi ArabiaScotlandSenegalSerbiaSierra LeoneSingaporeSomaliaSouth AfricaSouth AmericaSouth Central AsiaSouth Eastern AsiaSouthern EuropeSpainSri LankaSt. Vincent and the GrenadinesSudanSwedenSwitzerlandSyriaTaiwanThailandTrinidad and TobagoTurkeyUgandaUkraineUruguayUzbekistanVenezuelaVietnamWest IndiesWestern AfricaWestern AsiaWestern EuropeYemenZaireZimbabweAzores
Select to Compare
Race
Ancestry
AfghanAfricanAlaska NativeAlaskan AthabascanAlbanianAleutAlsatianAmericanApacheArabArapahoArgentineanArmenianAssyrian/Chaldean/SyriacAustralianAustrianBahamianBangladeshiBarbadianBasqueBelgianBelizeanBermudanBhutaneseBlackfeetBolivianBrazilianBritishBritish West IndianBulgarianBurmeseCajunCambodianCanadianCape VerdeanCarpatho RusynCelticCentral AmericanCentral American IndianCherokeeCheyenneChickasawChileanChineseChippewaChoctawColombianColvilleComancheCosta RicanCreeCreekCroatianCrowCubanCypriotCzechCzechoslovakianDanishDelawareDominicanDutchDutch West IndianEastern EuropeanEcuadorianEgyptianEnglishEstonianEthiopianEuropeanFijianFilipinoFinnishFrenchFrench American IndianFrench CanadianGermanGerman RussianGhanaianGreekGuamanian/ChamorroGuatemalanGuyaneseHaitianHmongHonduranHopiHoumaHungarianIcelanderIndian (Asian)IndonesianInupiatIranianIraqiIrishIroquoisIsraeliItalianJamaicanJapaneseJordanianKenyanKiowaKoreanLaotianLatvianLebaneseLiberianLumbeeLuxembourgerMacedonianMalaysianMalteseMarshalleseMenomineeMexicanMexican American IndianMongolianMoroccanNative HawaiianNavajoNepaleseNew ZealanderNicaraguanNigerianNorthern EuropeanNorwegianOkinawanOsageOttawaPaiutePakistaniPalestinianPanamanianParaguayanPennsylvania GermanPeruvianPimaPolishPortuguesePotawatomiPuebloPuerto RicanPuget Sound SalishRomanianRussianSalvadoranSamoanScandinavianScotch-IrishScottishSeminoleSenegaleseSerbianShoshoneSierra LeoneanSiouxSlavicSlovakSloveneSomaliSouth AfricanSouth AmericanSouth American IndianSoviet UnionSpaniardSpanishSpanish AmericanSpanish American IndianSri LankanSubsaharan AfricanSudaneseSwedishSwissSyrianTaiwaneseThaiTlingit-HaidaTohono O'OdhamTonganTrinidadian and TobagonianTsimshianTurkishU.S. Virgin IslanderUgandanUkrainianUruguayanUteVenezuelanVietnameseWelshWest IndianYakamaYaquiYugoslavianYumanYup'ikZimbabwean
Immigration
NonimmigrantsImmigrantsAfghanistanAfricaAlbaniaArgentinaArmeniaAsiaAustraliaAustriaBahamasBangladeshBarbadosBelarusBelgiumBelizeBoliviaBosnia and HerzegovinaBrazilBulgariaBurma/MyanmarCabo VerdeCambodiaCameroonCanadaCaribbeanCentral AmericaChileChinaColombiaCongoCosta RicaCroatiaCubaCzechoslovakiaDenmarkDominicaDominican RepublicEastern AfricaEastern AsiaEastern EuropeEcuadorEgyptEl SalvadorEnglandEritreaEthiopiaEuropeFijiFranceGermanyGhanaGreeceGrenadaGuatemalaGuyanaHaitiHondurasHong KongHungaryIndiaIndonesiaIranIraqIrelandIsraelItalyJamaicaJapanJordanKazakhstanKenyaKoreaKuwaitLaosLatin AmericaLatviaLebanonLiberiaLithuaniaMalaysiaMexicoMicronesiaMiddle AfricaMoldovaMoroccoNepalNetherlandsNicaraguaNigeriaNorth AmericaNorth MacedoniaNorthern AfricaNorthern EuropeNorwayOceaniaPakistanPanamaPeruPhilippinesPolandPortugalRomaniaRussiaSaudi ArabiaScotlandSenegalSerbiaSierra LeoneSingaporeSomaliaSouth AfricaSouth AmericaSouth Central AsiaSouth Eastern AsiaSouthern EuropeSpainSri LankaSt. Vincent and the GrenadinesSudanSwedenSwitzerlandSyriaTaiwanThailandTrinidad and TobagoTurkeyUgandaUkraineUruguayUzbekistanVenezuelaVietnamWest IndiesWestern AfricaWestern AsiaWestern EuropeYemenZaireZimbabweAzores
Married-Couple Family Poverty
Income
Poverty
Unemployment
Labor Participation
Family Structure
Vehicle Availability
Education Level
Disability

Lithuanian Married-Couple Family Poverty
Exceptional

4.0%
POVERTY | MARRIED-COUPLE FAMILIES
100.0/ 100
METRIC RATING
11th/ 347
METRIC RANK

Lithuanian Married-Couple Family Poverty Correlation Chart

The statistical analysis conducted on geographies consisting of 416,141,863 people shows a slight positive correlation between the proportion of Lithuanians and poverty level among married-couple families in the United States with a correlation coefficient (R) of 0.067 and weighted average of 4.0%. On average, for every 1% (one percent) increase in Lithuanians within a typical geography, there is an increase of 0.043% in poverty level among married-couple families.
Lithuanian Married-Couple Family Poverty
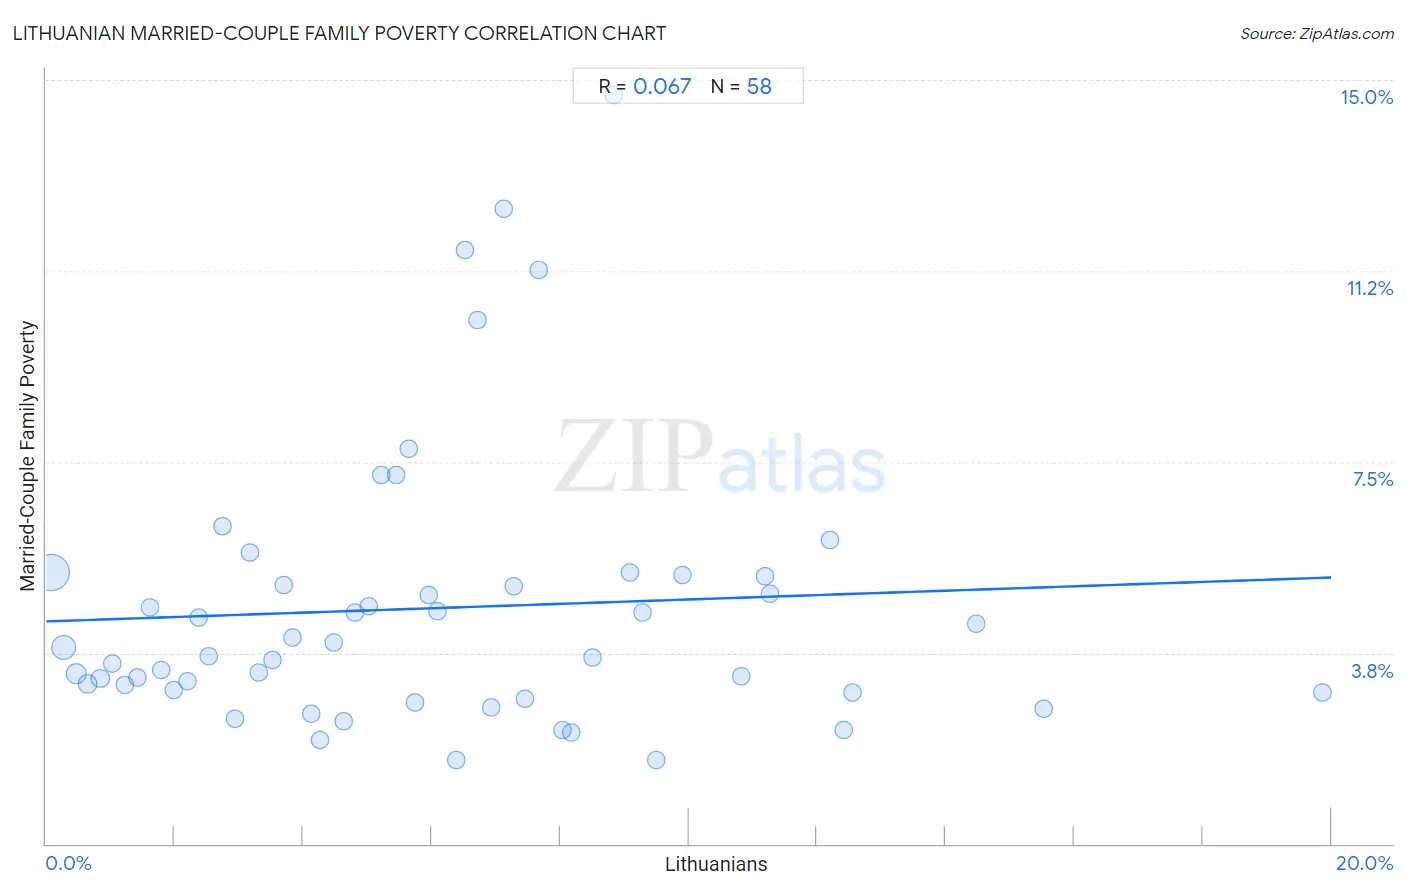
It is essential to understand that the correlation between the percentage of Lithuanians and poverty level among married-couple families does not imply a direct cause-and-effect relationship. It remains uncertain whether the presence of Lithuanians influences an upward or downward trend in the level of poverty level among married-couple families within an area, or if Lithuanians simply ended up residing in those areas with higher or lower levels of poverty level among married-couple families due to other factors.

Demographics Similar to Lithuanians by Married-Couple Family Poverty

In terms of married-couple family poverty, the demographic groups most similar to Lithuanians are Carpatho Rusyn (3.9%, a difference of 0.51%), Croatian (3.9%, a difference of 0.56%), Bulgarian (4.0%, a difference of 0.70%), Thai (3.9%, a difference of 1.0%), and Latvian (3.9%, a difference of 1.5%).
DemographicsRating | RankMarried-Couple Family Poverty
Slovenes
100.0
/100
|
#4
Exceptional
3.8%
Swedes
100.0
/100
|
#5
Exceptional
3.9%
Luxembourgers
100.0
/100
|
#6
Exceptional
3.9%
Latvians
100.0
/100
|
#7
Exceptional
3.9%
Thais
100.0
/100
|
#8
Exceptional
3.9%
Croatians
100.0
/100
|
#9
Exceptional
3.9%
Carpatho Rusyns
100.0
/100
|
#10
Exceptional
3.9%
Lithuanians
100.0
/100
|
#11
Exceptional
4.0%
Bulgarians
100.0
/100
|
#12
Exceptional
4.0%
Czechs
100.0
/100
|
#13
Exceptional
4.0%
Slovaks
100.0
/100
|
#14
Exceptional
4.0%
Poles
100.0
/100
|
#15
Exceptional
4.0%
Germans
100.0
/100
|
#16
Exceptional
4.0%
Filipinos
100.0
/100
|
#17
Exceptional
4.0%
Italians
100.0
/100
|
#18
Exceptional
4.0%

Lithuanian Married-Couple Family Poverty Correlation Summary

MeasurementLithuanian DataMarried-Couple Family Poverty Data
Minimum0.087%1.6%
Maximum19.9%14.7%
Range19.8%13.1%
Mean6.0%4.6%
Median5.6%3.8%
Interquartile 25% (IQ1)2.8%3.0%
Interquartile 75% (IQ3)8.5%5.3%
Interquartile Range (IQR)5.8%2.3%
Standard Deviation (Sample)4.2%2.7%
Standard Deviation (Population)4.2%2.7%

Correlation Details

Lithuanian PercentileSample SizeMarried-Couple Family Poverty
[
0.0%
-
0.5%
]
0.087%
257,731,6505.3%
[
0.0%
-
0.5%
]
0.27%
87,239,6593.9%
[
0.0%
-
0.5%
]
0.46%
34,570,9313.3%
[
0.5%
-
1.0%
]
0.65%
14,120,2523.1%
[
0.5%
-
1.0%
]
0.84%
7,926,5613.2%
[
1.0%
-
1.5%
]
1.03%
5,094,5753.5%
[
1.0%
-
1.5%
]
1.23%
2,508,2773.1%
[
1.0%
-
1.5%
]
1.41%
1,653,1143.3%
[
1.5%
-
2.0%
]
1.62%
1,061,8974.6%
[
1.5%
-
2.0%
]
1.79%
978,6143.4%
[
1.5%
-
2.0%
]
1.99%
670,8223.0%
[
2.0%
-
2.5%
]
2.19%
643,8633.2%
[
2.0%
-
2.5%
]
2.37%
506,8574.4%
[
2.5%
-
3.0%
]
2.53%
280,4103.7%
[
2.5%
-
3.0%
]
2.75%
249,8556.2%
[
2.5%
-
3.0%
]
2.94%
78,2152.4%
[
3.0%
-
3.5%
]
3.16%
77,2005.7%
[
3.0%
-
3.5%
]
3.31%
87,0663.4%
[
3.5%
-
4.0%
]
3.52%
129,7023.6%
[
3.5%
-
4.0%
]
3.70%
46,3595.1%
[
3.5%
-
4.0%
]
3.83%
15,2624.1%
[
4.0%
-
4.5%
]
4.12%
72,2972.5%
[
4.0%
-
4.5%
]
4.27%
70,3922.0%
[
4.0%
-
4.5%
]
4.47%
29,0843.9%
[
4.5%
-
5.0%
]
4.64%
43,2032.4%
[
4.5%
-
5.0%
]
4.80%
14,4324.5%
[
5.0%
-
5.5%
]
5.01%
70,4504.7%
[
5.0%
-
5.5%
]
5.21%
8,2867.2%
[
5.0%
-
5.5%
]
5.45%
3,2287.3%
[
5.5%
-
6.0%
]
5.65%
6,6367.8%
[
5.5%
-
6.0%
]
5.74%
5,7462.8%
[
5.5%
-
6.0%
]
5.96%
13,0834.9%
[
6.0%
-
6.5%
]
6.09%
5,5024.6%
[
6.0%
-
6.5%
]
6.38%
7,5061.7%
[
6.5%
-
7.0%
]
6.51%
9,50711.7%
[
6.5%
-
7.0%
]
6.72%
2,45610.3%
[
6.5%
-
7.0%
]
6.92%
1,2422.7%
[
7.0%
-
7.5%
]
7.13%
5,38612.5%
[
7.0%
-
7.5%
]
7.28%
5,7265.1%
[
7.0%
-
7.5%
]
7.45%
2,6312.8%
[
7.5%
-
8.0%
]
7.67%
1,82611.3%
[
8.0%
-
8.5%
]
8.03%
7,3002.2%
[
8.0%
-
8.5%
]
8.17%
1,1502.2%
[
8.5%
-
9.0%
]
8.50%
2,1643.7%
[
8.5%
-
9.0%
]
8.83%
11,09514.7%
[
9.0%
-
9.5%
]
9.08%
3,1385.3%
[
9.0%
-
9.5%
]
9.28%
6,8574.5%
[
9.0%
-
9.5%
]
9.50%
27,6691.6%
[
9.5%
-
10.0%
]
9.90%
21,6635.3%
[
10.5%
-
11.0%
]
10.82%
3,4113.3%
[
11.0%
-
11.5%
]
11.19%
4475.3%
[
11.0%
-
11.5%
]
11.26%
2224.9%
[
12.0%
-
12.5%
]
12.19%
8866.0%
[
12.0%
-
12.5%
]
12.40%
1,5722.2%
[
12.5%
-
13.0%
]
12.54%
2953.0%
[
14.0%
-
14.5%
]
14.46%
1,5144.3%
[
15.5%
-
16.0%
]
15.53%
1,6682.7%
[
19.5%
-
20.0%
]
19.87%
1,0523.0%