Nepalese Married-Couple Family Poverty
COMPARE
Nepalese
Select to Compare
Married-Couple Family Poverty
Nepalese Married-Couple Family Poverty
6.5%
POVERTY | MARRIED-COUPLE FAMILIES
0.0/ 100
METRIC RATING
289th/ 347
METRIC RANK
Nepalese Married-Couple Family Poverty Correlation Chart
The statistical analysis conducted on geographies consisting of 24,514,690 people shows a poor positive correlation between the proportion of Nepalese and poverty level among married-couple families in the United States with a correlation coefficient (R) of 0.151 and weighted average of 6.5%. On average, for every 1% (one percent) increase in Nepalese within a typical geography, there is an increase of 0.80% in poverty level among married-couple families.
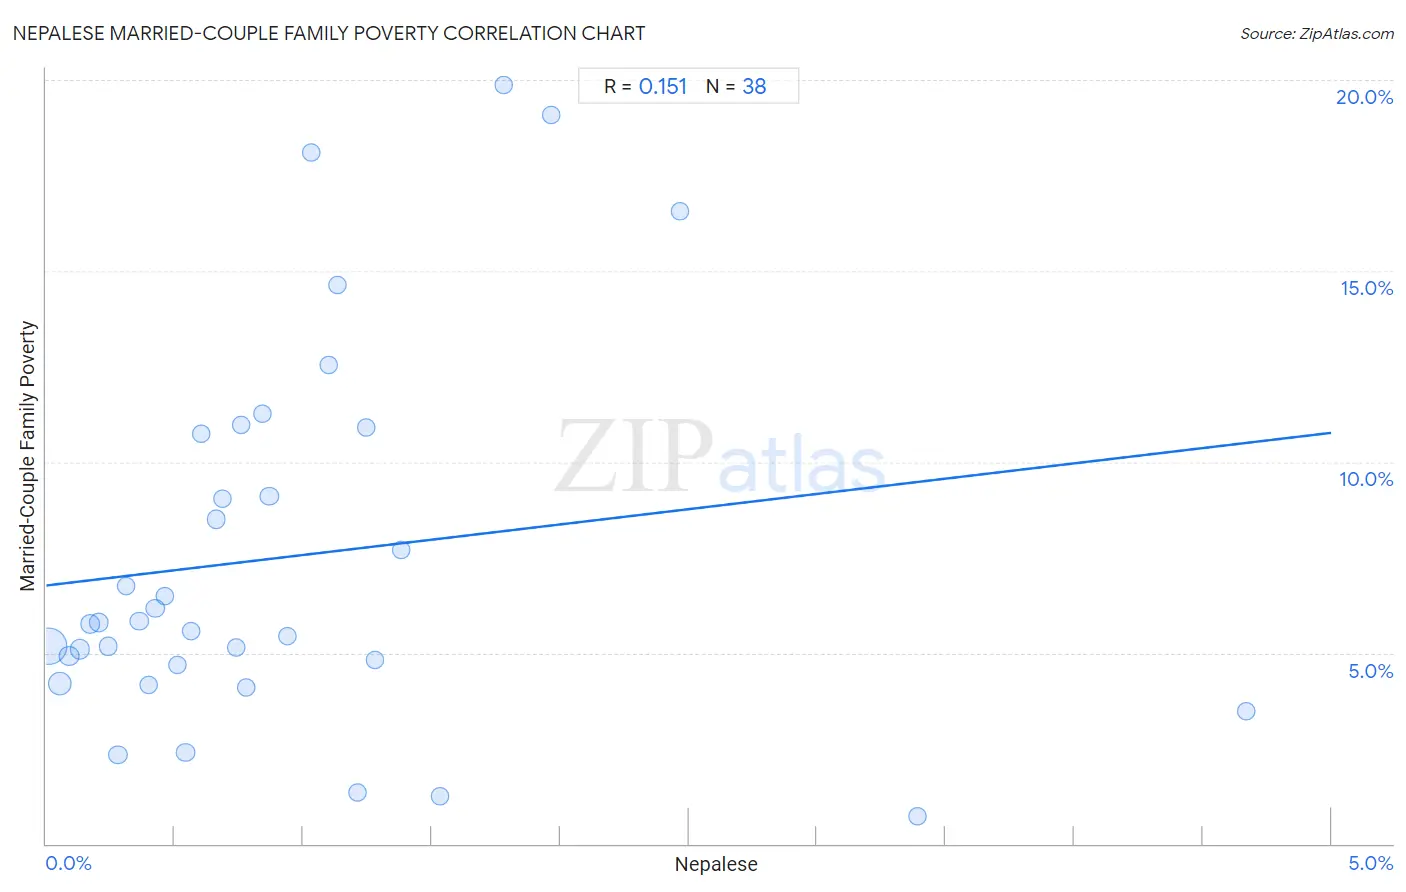
It is essential to understand that the correlation between the percentage of Nepalese and poverty level among married-couple families does not imply a direct cause-and-effect relationship. It remains uncertain whether the presence of Nepalese influences an upward or downward trend in the level of poverty level among married-couple families within an area, or if Nepalese simply ended up residing in those areas with higher or lower levels of poverty level among married-couple families due to other factors.
Demographics Similar to Nepalese by Married-Couple Family Poverty
In terms of married-couple family poverty, the demographic groups most similar to Nepalese are Salvadoran (6.5%, a difference of 0.17%), Immigrants from Barbados (6.5%, a difference of 0.23%), Belizean (6.5%, a difference of 0.26%), Ecuadorian (6.5%, a difference of 0.36%), and Immigrants from Lebanon (6.6%, a difference of 0.44%).
| Demographics | Rating | Rank | Married-Couple Family Poverty |
| Seminole | 0.0 /100 | #282 | Tragic 6.4% |
| Ute | 0.0 /100 | #283 | Tragic 6.4% |
| Dutch West Indians | 0.0 /100 | #284 | Tragic 6.4% |
| Blacks/African Americans | 0.0 /100 | #285 | Tragic 6.5% |
| Guyanese | 0.0 /100 | #286 | Tragic 6.5% |
| Ecuadorians | 0.0 /100 | #287 | Tragic 6.5% |
| Salvadorans | 0.0 /100 | #288 | Tragic 6.5% |
| Nepalese | 0.0 /100 | #289 | Tragic 6.5% |
| Immigrants from Barbados | 0.0 /100 | #290 | Tragic 6.5% |
| Belizeans | 0.0 /100 | #291 | Tragic 6.5% |
| Immigrants from Lebanon | 0.0 /100 | #292 | Tragic 6.6% |
| Arapaho | 0.0 /100 | #293 | Tragic 6.6% |
| Bahamians | 0.0 /100 | #294 | Tragic 6.6% |
| Immigrants from Uzbekistan | 0.0 /100 | #295 | Tragic 6.6% |
| U.S. Virgin Islanders | 0.0 /100 | #296 | Tragic 6.6% |
Nepalese Married-Couple Family Poverty Correlation Summary
| Measurement | Nepalese Data | Married-Couple Family Poverty Data |
| Minimum | 0.0096% | 0.73% |
| Maximum | 4.7% | 19.9% |
| Range | 4.7% | 19.2% |
| Mean | 0.94% | 7.5% |
| Median | 0.71% | 5.8% |
| Interquartile 25% (IQ1) | 0.36% | 4.7% |
| Interquartile 75% (IQ3) | 1.2% | 10.7% |
| Interquartile Range (IQR) | 0.85% | 6.1% |
| Standard Deviation (Sample) | 0.94% | 4.9% |
| Standard Deviation (Population) | 0.92% | 4.9% |
Correlation Details
| Nepalese Percentile | Sample Size | Married-Couple Family Poverty |
[ 0.0% - 0.5% ] 0.0096% | 13,361,715 | 5.2% |
[ 0.0% - 0.5% ] 0.054% | 3,796,807 | 4.2% |
[ 0.0% - 0.5% ] 0.089% | 1,243,192 | 4.9% |
[ 0.0% - 0.5% ] 0.13% | 1,098,838 | 5.1% |
[ 0.0% - 0.5% ] 0.17% | 641,382 | 5.7% |
[ 0.0% - 0.5% ] 0.21% | 853,168 | 5.8% |
[ 0.0% - 0.5% ] 0.24% | 759,597 | 5.2% |
[ 0.0% - 0.5% ] 0.28% | 277,682 | 2.3% |
[ 0.0% - 0.5% ] 0.31% | 230,778 | 6.7% |
[ 0.0% - 0.5% ] 0.36% | 142,782 | 5.8% |
[ 0.0% - 0.5% ] 0.40% | 123,268 | 4.2% |
[ 0.0% - 0.5% ] 0.42% | 568,342 | 6.2% |
[ 0.0% - 0.5% ] 0.46% | 197,873 | 6.5% |
[ 0.5% - 1.0% ] 0.51% | 111,359 | 4.7% |
[ 0.5% - 1.0% ] 0.54% | 87,441 | 2.4% |
[ 0.5% - 1.0% ] 0.56% | 189,407 | 5.6% |
[ 0.5% - 1.0% ] 0.60% | 38,459 | 10.7% |
[ 0.5% - 1.0% ] 0.66% | 91,359 | 8.5% |
[ 0.5% - 1.0% ] 0.69% | 60,850 | 9.0% |
[ 0.5% - 1.0% ] 0.74% | 22,145 | 5.1% |
[ 0.5% - 1.0% ] 0.76% | 114,499 | 11.0% |
[ 0.5% - 1.0% ] 0.78% | 16,150 | 4.1% |
[ 0.5% - 1.0% ] 0.84% | 56,650 | 11.3% |
[ 0.5% - 1.0% ] 0.87% | 57,943 | 9.1% |
[ 0.5% - 1.0% ] 0.94% | 118,105 | 5.4% |
[ 1.0% - 1.5% ] 1.03% | 7,581 | 18.1% |
[ 1.0% - 1.5% ] 1.10% | 20,835 | 12.5% |
[ 1.0% - 1.5% ] 1.13% | 41,311 | 14.6% |
[ 1.0% - 1.5% ] 1.21% | 5,202 | 1.3% |
[ 1.0% - 1.5% ] 1.25% | 2,486 | 10.9% |
[ 1.0% - 1.5% ] 1.28% | 33,116 | 4.8% |
[ 1.0% - 1.5% ] 1.38% | 80,543 | 7.7% |
[ 1.5% - 2.0% ] 1.53% | 10,902 | 1.2% |
[ 1.5% - 2.0% ] 1.78% | 14,824 | 19.9% |
[ 1.5% - 2.0% ] 1.96% | 30,556 | 19.1% |
[ 2.0% - 2.5% ] 2.47% | 1,297 | 16.6% |
[ 3.0% - 3.5% ] 3.39% | 3,955 | 0.73% |
[ 4.5% - 5.0% ] 4.67% | 2,291 | 3.5% |