Pennsylvania German Married-Couple Family Poverty
COMPARE
Pennsylvania German
Select to Compare
Married-Couple Family Poverty
Pennsylvania German Married-Couple Family Poverty
5.1%
POVERTY | MARRIED-COUPLE FAMILIES
68.5/ 100
METRIC RATING
160th/ 347
METRIC RANK
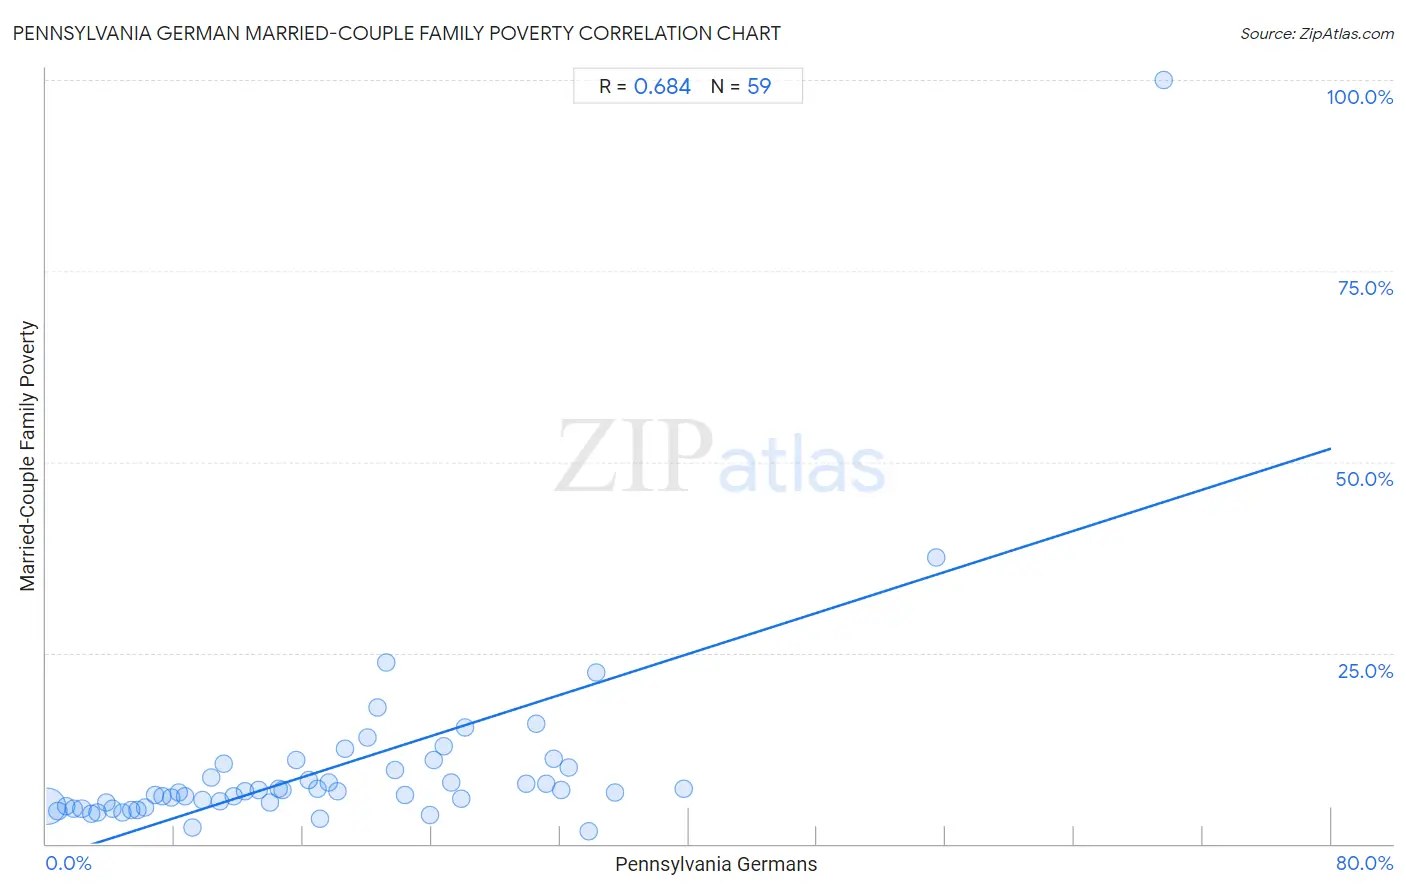
Pennsylvania German Married-Couple Family Poverty Correlation Chart
The statistical analysis conducted on geographies consisting of 232,029,160 people shows a significant positive correlation between the proportion of Pennsylvania Germans and poverty level among married-couple families in the United States with a correlation coefficient (R) of 0.684 and weighted average of 5.1%. On average, for every 1% (one percent) increase in Pennsylvania Germans within a typical geography, there is an increase of 0.67% in poverty level among married-couple families.
It is essential to understand that the correlation between the percentage of Pennsylvania Germans and poverty level among married-couple families does not imply a direct cause-and-effect relationship. It remains uncertain whether the presence of Pennsylvania Germans influences an upward or downward trend in the level of poverty level among married-couple families within an area, or if Pennsylvania Germans simply ended up residing in those areas with higher or lower levels of poverty level among married-couple families due to other factors.
Demographics Similar to Pennsylvania Germans by Married-Couple Family Poverty
In terms of married-couple family poverty, the demographic groups most similar to Pennsylvania Germans are Ethiopian (5.1%, a difference of 0.060%), Immigrants from South Eastern Asia (5.1%, a difference of 0.26%), Immigrants from Saudi Arabia (5.1%, a difference of 0.26%), Immigrants from Jordan (5.1%, a difference of 0.27%), and Argentinean (5.1%, a difference of 0.30%).
| Demographics | Rating | Rank | Married-Couple Family Poverty |
| Immigrants from Kuwait | 76.3 /100 | #153 | Good 5.0% |
| Delaware | 73.7 /100 | #154 | Good 5.1% |
| Immigrants from Ethiopia | 72.4 /100 | #155 | Good 5.1% |
| Sri Lankans | 72.2 /100 | #156 | Good 5.1% |
| Argentineans | 70.7 /100 | #157 | Good 5.1% |
| Immigrants from South Eastern Asia | 70.4 /100 | #158 | Good 5.1% |
| Immigrants from Saudi Arabia | 70.3 /100 | #159 | Good 5.1% |
| Pennsylvania Germans | 68.5 /100 | #160 | Good 5.1% |
| Ethiopians | 68.1 /100 | #161 | Good 5.1% |
| Immigrants from Jordan | 66.5 /100 | #162 | Good 5.1% |
| Sierra Leoneans | 64.1 /100 | #163 | Good 5.1% |
| Hawaiians | 62.3 /100 | #164 | Good 5.1% |
| Immigrants from Malaysia | 62.2 /100 | #165 | Good 5.1% |
| Paraguayans | 61.5 /100 | #166 | Good 5.1% |
| Costa Ricans | 61.5 /100 | #167 | Good 5.1% |
Pennsylvania German Married-Couple Family Poverty Correlation Summary
| Measurement | Pennsylvania German Data | Married-Couple Family Poverty Data |
| Minimum | 0.057% | 1.6% |
| Maximum | 69.6% | 100.0% |
| Range | 69.5% | 98.4% |
| Mean | 17.7% | 9.9% |
| Median | 15.6% | 6.9% |
| Interquartile 25% (IQ1) | 7.3% | 4.9% |
| Interquartile 75% (IQ3) | 25.2% | 10.0% |
| Interquartile Range (IQR) | 18.0% | 5.1% |
| Standard Deviation (Sample) | 13.5% | 13.3% |
| Standard Deviation (Population) | 13.4% | 13.2% |
Correlation Details
| Pennsylvania German Percentile | Sample Size | Married-Couple Family Poverty |
[ 0.0% - 0.5% ] 0.057% | 220,870,542 | 4.9% |
[ 0.5% - 1.0% ] 0.72% | 5,223,023 | 4.3% |
[ 1.0% - 1.5% ] 1.23% | 1,956,596 | 4.9% |
[ 1.5% - 2.0% ] 1.72% | 1,299,058 | 4.7% |
[ 2.0% - 2.5% ] 2.22% | 639,177 | 4.5% |
[ 2.5% - 3.0% ] 2.77% | 412,432 | 4.0% |
[ 3.0% - 3.5% ] 3.21% | 317,594 | 4.1% |
[ 3.5% - 4.0% ] 3.74% | 221,402 | 5.4% |
[ 4.0% - 4.5% ] 4.15% | 259,156 | 4.6% |
[ 4.5% - 5.0% ] 4.75% | 157,580 | 4.0% |
[ 5.0% - 5.5% ] 5.29% | 103,518 | 4.4% |
[ 5.5% - 6.0% ] 5.66% | 72,643 | 4.4% |
[ 6.0% - 6.5% ] 6.14% | 50,432 | 4.8% |
[ 6.5% - 7.0% ] 6.76% | 91,997 | 6.3% |
[ 7.0% - 7.5% ] 7.27% | 19,658 | 6.3% |
[ 7.5% - 8.0% ] 7.82% | 18,706 | 6.1% |
[ 8.0% - 8.5% ] 8.26% | 50,141 | 6.7% |
[ 8.5% - 9.0% ] 8.65% | 35,142 | 6.3% |
[ 9.0% - 9.5% ] 9.13% | 14,052 | 2.1% |
[ 9.5% - 10.0% ] 9.73% | 17,309 | 5.7% |
[ 10.0% - 10.5% ] 10.25% | 24,516 | 8.7% |
[ 10.5% - 11.0% ] 10.81% | 34,430 | 5.5% |
[ 11.0% - 11.5% ] 11.07% | 244 | 10.5% |
[ 11.5% - 12.0% ] 11.68% | 23,278 | 6.3% |
[ 12.0% - 12.5% ] 12.37% | 19,489 | 6.9% |
[ 13.0% - 13.5% ] 13.23% | 11,382 | 7.1% |
[ 13.5% - 14.0% ] 13.95% | 803 | 5.4% |
[ 14.0% - 14.5% ] 14.46% | 4,121 | 7.2% |
[ 14.5% - 15.0% ] 14.68% | 6,594 | 7.0% |
[ 15.5% - 16.0% ] 15.58% | 1,014 | 11.0% |
[ 16.0% - 16.5% ] 16.34% | 2,087 | 8.3% |
[ 16.5% - 17.0% ] 16.90% | 10,985 | 7.2% |
[ 17.0% - 17.5% ] 17.04% | 1,455 | 3.3% |
[ 17.5% - 18.0% ] 17.60% | 500 | 8.1% |
[ 18.0% - 18.5% ] 18.13% | 6,917 | 6.9% |
[ 18.5% - 19.0% ] 18.61% | 704 | 12.5% |
[ 20.0% - 20.5% ] 20.03% | 1,398 | 14.0% |
[ 20.5% - 21.0% ] 20.66% | 847 | 17.8% |
[ 21.0% - 21.5% ] 21.15% | 468 | 23.7% |
[ 21.5% - 22.0% ] 21.69% | 4,699 | 9.7% |
[ 22.0% - 22.5% ] 22.31% | 4,576 | 6.3% |
[ 23.5% - 24.0% ] 23.92% | 1,522 | 3.7% |
[ 24.0% - 24.5% ] 24.12% | 2,156 | 11.0% |
[ 24.5% - 25.0% ] 24.71% | 3,419 | 12.8% |
[ 25.0% - 25.5% ] 25.24% | 5,376 | 8.0% |
[ 25.5% - 26.0% ] 25.83% | 302 | 5.8% |
[ 26.0% - 26.5% ] 26.07% | 560 | 15.3% |
[ 29.5% - 30.0% ] 29.88% | 1,824 | 7.8% |
[ 30.5% - 31.0% ] 30.50% | 318 | 15.7% |
[ 31.0% - 31.5% ] 31.12% | 1,417 | 7.9% |
[ 31.5% - 32.0% ] 31.58% | 57 | 11.1% |
[ 32.0% - 32.5% ] 32.06% | 499 | 7.0% |
[ 32.5% - 33.0% ] 32.54% | 16,090 | 10.0% |
[ 33.5% - 34.0% ] 33.78% | 370 | 1.6% |
[ 34.0% - 34.5% ] 34.24% | 2,030 | 22.4% |
[ 35.0% - 35.5% ] 35.42% | 96 | 6.7% |
[ 39.5% - 40.0% ] 39.66% | 2,335 | 7.3% |
[ 55.0% - 55.5% ] 55.45% | 101 | 37.5% |
[ 69.5% - 70.0% ] 69.57% | 23 | 100.0% |