Immigrants from the Azores Married-Couple Family Poverty

COMPARE

Immigrants from the Azores
Race
Ancestry
AfghanAfricanAlaska NativeAlaskan AthabascanAlbanianAleutAlsatianAmericanApacheArabArapahoArgentineanArmenianAssyrian/Chaldean/SyriacAustralianAustrianBahamianBangladeshiBarbadianBasqueBelgianBelizeanBermudanBhutaneseBlackfeetBolivianBrazilianBritishBritish West IndianBulgarianBurmeseCajunCambodianCanadianCape VerdeanCarpatho RusynCelticCentral AmericanCentral American IndianCherokeeCheyenneChickasawChileanChineseChippewaChoctawColombianColvilleComancheCosta RicanCreeCreekCroatianCrowCubanCypriotCzechCzechoslovakianDanishDelawareDominicanDutchDutch West IndianEastern EuropeanEcuadorianEgyptianEnglishEstonianEthiopianEuropeanFijianFilipinoFinnishFrenchFrench American IndianFrench CanadianGermanGerman RussianGhanaianGreekGuamanian/ChamorroGuatemalanGuyaneseHaitianHmongHonduranHopiHoumaHungarianIcelanderIndian (Asian)IndonesianInupiatIranianIraqiIrishIroquoisIsraeliItalianJamaicanJapaneseJordanianKenyanKiowaKoreanLaotianLatvianLebaneseLiberianLithuanianLumbeeLuxembourgerMacedonianMalaysianMalteseMarshalleseMenomineeMexicanMexican American IndianMongolianMoroccanNative HawaiianNavajoNepaleseNew ZealanderNicaraguanNigerianNorthern EuropeanNorwegianOkinawanOsageOttawaPaiutePakistaniPalestinianPanamanianParaguayanPennsylvania GermanPeruvianPimaPolishPortuguesePotawatomiPuebloPuerto RicanPuget Sound SalishRomanianRussianSalvadoranSamoanScandinavianScotch-IrishScottishSeminoleSenegaleseSerbianShoshoneSierra LeoneanSiouxSlavicSlovakSloveneSomaliSouth AfricanSouth AmericanSouth American IndianSoviet UnionSpaniardSpanishSpanish AmericanSpanish American IndianSri LankanSubsaharan AfricanSudaneseSwedishSwissSyrianTaiwaneseThaiTlingit-HaidaTohono O'OdhamTonganTrinidadian and TobagonianTsimshianTurkishU.S. Virgin IslanderUgandanUkrainianUruguayanUteVenezuelanVietnameseWelshWest IndianYakamaYaquiYugoslavianYumanYup'ikZimbabwean
Immigration
NonimmigrantsImmigrantsAfghanistanAfricaAlbaniaArgentinaArmeniaAsiaAustraliaAustriaBahamasBangladeshBarbadosBelarusBelgiumBelizeBoliviaBosnia and HerzegovinaBrazilBulgariaBurma/MyanmarCabo VerdeCambodiaCameroonCanadaCaribbeanCentral AmericaChileChinaColombiaCongoCosta RicaCroatiaCubaCzechoslovakiaDenmarkDominicaDominican RepublicEastern AfricaEastern AsiaEastern EuropeEcuadorEgyptEl SalvadorEnglandEritreaEthiopiaEuropeFijiFranceGermanyGhanaGreeceGrenadaGuatemalaGuyanaHaitiHondurasHong KongHungaryIndiaIndonesiaIranIraqIrelandIsraelItalyJamaicaJapanJordanKazakhstanKenyaKoreaKuwaitLaosLatin AmericaLatviaLebanonLiberiaLithuaniaMalaysiaMexicoMicronesiaMiddle AfricaMoldovaMoroccoNepalNetherlandsNicaraguaNigeriaNorth AmericaNorth MacedoniaNorthern AfricaNorthern EuropeNorwayOceaniaPakistanPanamaPeruPhilippinesPolandPortugalRomaniaRussiaSaudi ArabiaScotlandSenegalSerbiaSierra LeoneSingaporeSomaliaSouth AfricaSouth AmericaSouth Central AsiaSouth Eastern AsiaSouthern EuropeSpainSri LankaSt. Vincent and the GrenadinesSudanSwedenSwitzerlandSyriaTaiwanThailandTrinidad and TobagoTurkeyUgandaUkraineUruguayUzbekistanVenezuelaVietnamWest IndiesWestern AfricaWestern AsiaWestern EuropeYemenZaireZimbabweAzores
Select to Compare
Race
Ancestry
AfghanAfricanAlaska NativeAlaskan AthabascanAlbanianAleutAlsatianAmericanApacheArabArapahoArgentineanArmenianAssyrian/Chaldean/SyriacAustralianAustrianBahamianBangladeshiBarbadianBasqueBelgianBelizeanBermudanBhutaneseBlackfeetBolivianBrazilianBritishBritish West IndianBulgarianBurmeseCajunCambodianCanadianCape VerdeanCarpatho RusynCelticCentral AmericanCentral American IndianCherokeeCheyenneChickasawChileanChineseChippewaChoctawColombianColvilleComancheCosta RicanCreeCreekCroatianCrowCubanCypriotCzechCzechoslovakianDanishDelawareDominicanDutchDutch West IndianEastern EuropeanEcuadorianEgyptianEnglishEstonianEthiopianEuropeanFijianFilipinoFinnishFrenchFrench American IndianFrench CanadianGermanGerman RussianGhanaianGreekGuamanian/ChamorroGuatemalanGuyaneseHaitianHmongHonduranHopiHoumaHungarianIcelanderIndian (Asian)IndonesianInupiatIranianIraqiIrishIroquoisIsraeliItalianJamaicanJapaneseJordanianKenyanKiowaKoreanLaotianLatvianLebaneseLiberianLithuanianLumbeeLuxembourgerMacedonianMalaysianMalteseMarshalleseMenomineeMexicanMexican American IndianMongolianMoroccanNative HawaiianNavajoNepaleseNew ZealanderNicaraguanNigerianNorthern EuropeanNorwegianOkinawanOsageOttawaPaiutePakistaniPalestinianPanamanianParaguayanPennsylvania GermanPeruvianPimaPolishPortuguesePotawatomiPuebloPuerto RicanPuget Sound SalishRomanianRussianSalvadoranSamoanScandinavianScotch-IrishScottishSeminoleSenegaleseSerbianShoshoneSierra LeoneanSiouxSlavicSlovakSloveneSomaliSouth AfricanSouth AmericanSouth American IndianSoviet UnionSpaniardSpanishSpanish AmericanSpanish American IndianSri LankanSubsaharan AfricanSudaneseSwedishSwissSyrianTaiwaneseThaiTlingit-HaidaTohono O'OdhamTonganTrinidadian and TobagonianTsimshianTurkishU.S. Virgin IslanderUgandanUkrainianUruguayanUteVenezuelanVietnameseWelshWest IndianYakamaYaquiYugoslavianYumanYup'ikZimbabwean
Immigration
NonimmigrantsImmigrantsAfghanistanAfricaAlbaniaArgentinaArmeniaAsiaAustraliaAustriaBahamasBangladeshBarbadosBelarusBelgiumBelizeBoliviaBosnia and HerzegovinaBrazilBulgariaBurma/MyanmarCabo VerdeCambodiaCameroonCanadaCaribbeanCentral AmericaChileChinaColombiaCongoCosta RicaCroatiaCubaCzechoslovakiaDenmarkDominicaDominican RepublicEastern AfricaEastern AsiaEastern EuropeEcuadorEgyptEl SalvadorEnglandEritreaEthiopiaEuropeFijiFranceGermanyGhanaGreeceGrenadaGuatemalaGuyanaHaitiHondurasHong KongHungaryIndiaIndonesiaIranIraqIrelandIsraelItalyJamaicaJapanJordanKazakhstanKenyaKoreaKuwaitLaosLatin AmericaLatviaLebanonLiberiaLithuaniaMalaysiaMexicoMicronesiaMiddle AfricaMoldovaMoroccoNepalNetherlandsNicaraguaNigeriaNorth AmericaNorth MacedoniaNorthern AfricaNorthern EuropeNorwayOceaniaPakistanPanamaPeruPhilippinesPolandPortugalRomaniaRussiaSaudi ArabiaScotlandSenegalSerbiaSierra LeoneSingaporeSomaliaSouth AfricaSouth AmericaSouth Central AsiaSouth Eastern AsiaSouthern EuropeSpainSri LankaSt. Vincent and the GrenadinesSudanSwedenSwitzerlandSyriaTaiwanThailandTrinidad and TobagoTurkeyUgandaUkraineUruguayUzbekistanVenezuelaVietnamWest IndiesWestern AfricaWestern AsiaWestern EuropeYemenZaireZimbabwe
Married-Couple Family Poverty
Income
Poverty
Unemployment
Labor Participation
Family Structure
Vehicle Availability
Education Level
Disability

Immigrants from the Azores Married-Couple Family Poverty
Fair

5.4%
POVERTY | MARRIED-COUPLE FAMILIES
27.5/ 100
METRIC RATING
195th/ 347
METRIC RANK

Immigrants from the Azores Married-Couple Family Poverty Correlation Chart

The statistical analysis conducted on geographies consisting of 46,091,890 people shows a moderate positive correlation between the proportion of Immigrants from the Azores and poverty level among married-couple families in the United States with a correlation coefficient (R) of 0.478 and weighted average of 5.4%. On average, for every 1% (one percent) increase in Immigrants from the Azores within a typical geography, there is an increase of 0.76% in poverty level among married-couple families.
Immigrants from the Azores Married-Couple Family Poverty
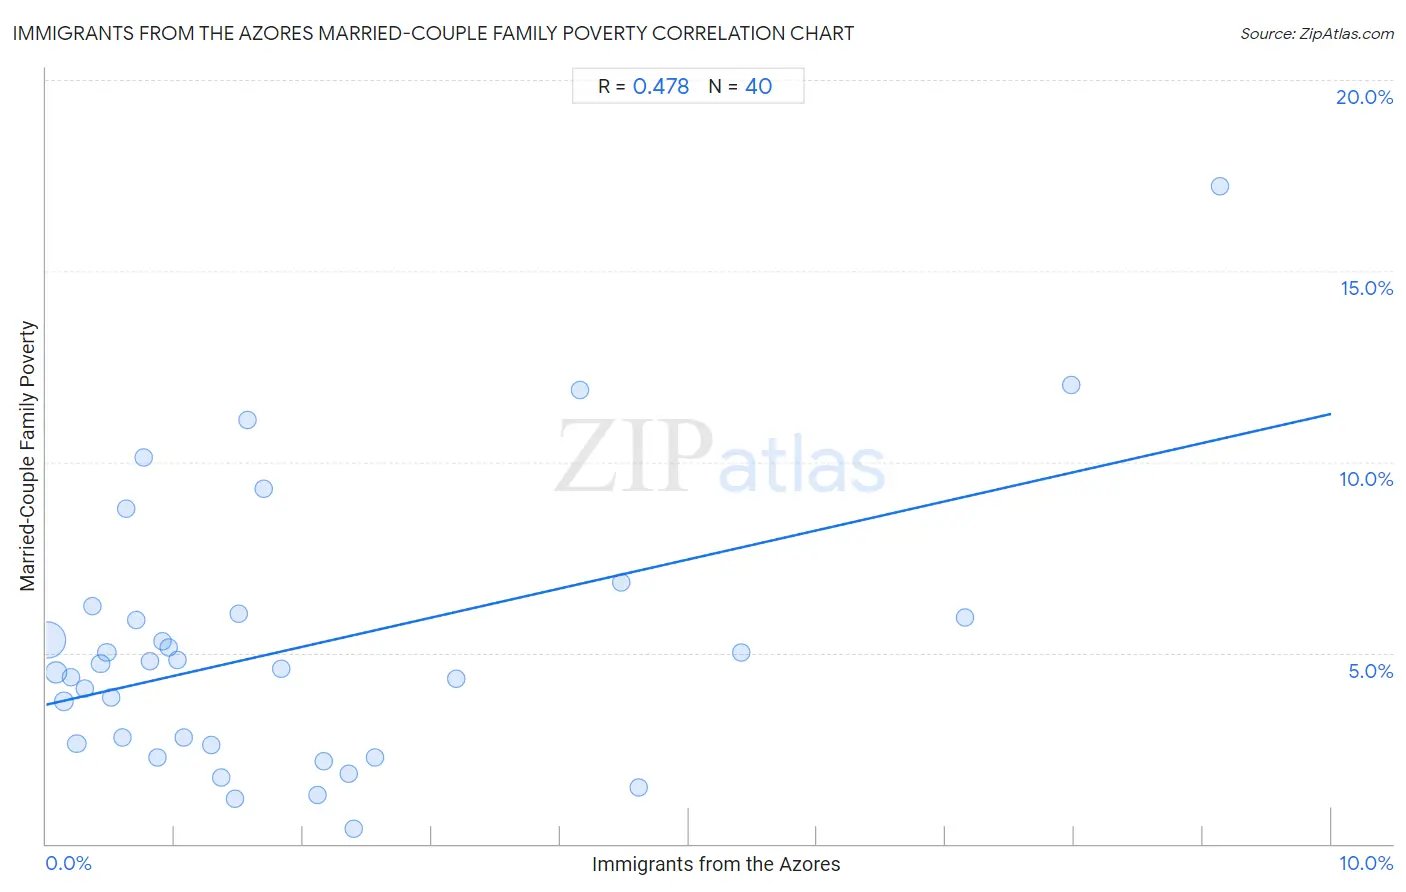
It is essential to understand that the correlation between the percentage of Immigrants from the Azores and poverty level among married-couple families does not imply a direct cause-and-effect relationship. It remains uncertain whether the presence of Immigrants from the Azores influences an upward or downward trend in the level of poverty level among married-couple families within an area, or if Immigrants from the Azores simply ended up residing in those areas with higher or lower levels of poverty level among married-couple families due to other factors.

Demographics Similar to Immigrants from the Azores by Married-Couple Family Poverty

In terms of married-couple family poverty, the demographic groups most similar to Immigrants from the Azores are Spaniard (5.4%, a difference of 0.020%), Immigrants from Israel (5.4%, a difference of 0.040%), Liberian (5.4%, a difference of 0.17%), Immigrants from Belarus (5.4%, a difference of 0.20%), and Malaysian (5.4%, a difference of 0.27%).
DemographicsRating | RankMarried-Couple Family Poverty
Israelis
33.1
/100
|
#188
Fair
5.3%
South American Indians
32.5
/100
|
#189
Fair
5.3%
Ugandans
31.6
/100
|
#190
Fair
5.3%
Immigrants from Cabo Verde
30.9
/100
|
#191
Fair
5.3%
Cape Verdeans
30.7
/100
|
#192
Fair
5.3%
Malaysians
29.5
/100
|
#193
Fair
5.4%
Immigrants from Israel
27.8
/100
|
#194
Fair
5.4%
Immigrants from the Azores
27.5
/100
|
#195
Fair
5.4%
Spaniards
27.4
/100
|
#196
Fair
5.4%
Liberians
26.3
/100
|
#197
Fair
5.4%
Immigrants from Belarus
26.2
/100
|
#198
Fair
5.4%
Uruguayans
25.0
/100
|
#199
Fair
5.4%
Immigrants from Morocco
24.3
/100
|
#200
Fair
5.4%
Lebanese
24.1
/100
|
#201
Fair
5.4%
Immigrants from Middle Africa
23.8
/100
|
#202
Fair
5.4%

Immigrants from the Azores Married-Couple Family Poverty Correlation Summary

MeasurementImmigrants from the Azores DataMarried-Couple Family Poverty Data
Minimum0.012%0.40%
Maximum9.1%17.2%
Range9.1%16.8%
Mean2.0%5.2%
Median1.2%4.6%
Interquartile 25% (IQ1)0.55%2.6%
Interquartile 75% (IQ3)2.4%6.0%
Interquartile Range (IQR)1.8%3.4%
Standard Deviation (Sample)2.2%3.5%
Standard Deviation (Population)2.2%3.5%

Correlation Details

Immigrants from the Azores PercentileSample SizeMarried-Couple Family Poverty
[
0.0%
-
0.5%
]
0.012%
32,839,0725.3%
[
0.0%
-
0.5%
]
0.077%
6,952,9714.5%
[
0.0%
-
0.5%
]
0.14%
1,745,7573.7%
[
0.0%
-
0.5%
]
0.19%
1,123,4864.4%
[
0.0%
-
0.5%
]
0.24%
277,5262.6%
[
0.0%
-
0.5%
]
0.30%
734,9994.1%
[
0.0%
-
0.5%
]
0.36%
342,9146.2%
[
0.0%
-
0.5%
]
0.42%
118,8774.7%
[
0.0%
-
0.5%
]
0.47%
118,3045.0%
[
0.5%
-
1.0%
]
0.51%
236,0853.8%
[
0.5%
-
1.0%
]
0.60%
134,3632.8%
[
0.5%
-
1.0%
]
0.62%
241,5968.8%
[
0.5%
-
1.0%
]
0.70%
87,4005.9%
[
0.5%
-
1.0%
]
0.76%
174,94310.1%
[
0.5%
-
1.0%
]
0.80%
140,8254.8%
[
0.5%
-
1.0%
]
0.87%
38,8082.3%
[
0.5%
-
1.0%
]
0.90%
31,9455.3%
[
0.5%
-
1.0%
]
0.95%
194,6055.1%
[
1.0%
-
1.5%
]
1.03%
109,0204.8%
[
1.0%
-
1.5%
]
1.07%
24,2972.8%
[
1.0%
-
1.5%
]
1.28%
32,1562.6%
[
1.0%
-
1.5%
]
1.36%
11,4311.7%
[
1.0%
-
1.5%
]
1.46%
15,9071.2%
[
1.0%
-
1.5%
]
1.49%
25,8476.0%
[
1.5%
-
2.0%
]
1.57%
7,15411.1%
[
1.5%
-
2.0%
]
1.69%
9489.3%
[
1.5%
-
2.0%
]
1.82%
4,6604.6%
[
2.0%
-
2.5%
]
2.11%
13,7811.3%
[
2.0%
-
2.5%
]
2.16%
5,5912.1%
[
2.0%
-
2.5%
]
2.36%
8911.8%
[
2.0%
-
2.5%
]
2.40%
22,4200.40%
[
2.5%
-
3.0%
]
2.55%
47,0122.2%
[
3.0%
-
3.5%
]
3.19%
17,1644.3%
[
4.0%
-
4.5%
]
4.15%
18,44511.9%
[
4.0%
-
4.5%
]
4.47%
131,5626.8%
[
4.5%
-
5.0%
]
4.61%
21,7421.5%
[
5.0%
-
5.5%
]
5.41%
30,5585.0%
[
7.0%
-
7.5%
]
7.15%
1,5815.9%
[
7.5%
-
8.0%
]
7.98%
8,76312.0%
[
9.0%
-
9.5%
]
9.13%
6,48417.2%