Moroccan Married-Couple Family Poverty

COMPARE

Moroccan
Race
Ancestry
AfghanAfricanAlaska NativeAlaskan AthabascanAlbanianAleutAlsatianAmericanApacheArabArapahoArgentineanArmenianAssyrian/Chaldean/SyriacAustralianAustrianBahamianBangladeshiBarbadianBasqueBelgianBelizeanBermudanBhutaneseBlackfeetBolivianBrazilianBritishBritish West IndianBulgarianBurmeseCajunCambodianCanadianCape VerdeanCarpatho RusynCelticCentral AmericanCentral American IndianCherokeeCheyenneChickasawChileanChineseChippewaChoctawColombianColvilleComancheCosta RicanCreeCreekCroatianCrowCubanCypriotCzechCzechoslovakianDanishDelawareDominicanDutchDutch West IndianEastern EuropeanEcuadorianEgyptianEnglishEstonianEthiopianEuropeanFijianFilipinoFinnishFrenchFrench American IndianFrench CanadianGermanGerman RussianGhanaianGreekGuamanian/ChamorroGuatemalanGuyaneseHaitianHmongHonduranHopiHoumaHungarianIcelanderIndian (Asian)IndonesianInupiatIranianIraqiIrishIroquoisIsraeliItalianJamaicanJapaneseJordanianKenyanKiowaKoreanLaotianLatvianLebaneseLiberianLithuanianLumbeeLuxembourgerMacedonianMalaysianMalteseMarshalleseMenomineeMexicanMexican American IndianMongolianMoroccanNative HawaiianNavajoNepaleseNew ZealanderNicaraguanNigerianNorthern EuropeanNorwegianOkinawanOsageOttawaPaiutePakistaniPalestinianPanamanianParaguayanPennsylvania GermanPeruvianPimaPolishPortuguesePotawatomiPuebloPuerto RicanPuget Sound SalishRomanianRussianSalvadoranSamoanScandinavianScotch-IrishScottishSeminoleSenegaleseSerbianShoshoneSierra LeoneanSiouxSlavicSlovakSloveneSomaliSouth AfricanSouth AmericanSouth American IndianSoviet UnionSpaniardSpanishSpanish AmericanSpanish American IndianSri LankanSubsaharan AfricanSudaneseSwedishSwissSyrianTaiwaneseThaiTlingit-HaidaTohono O'OdhamTonganTrinidadian and TobagonianTsimshianTurkishU.S. Virgin IslanderUgandanUkrainianUruguayanUteVenezuelanVietnameseWelshWest IndianYakamaYaquiYugoslavianYumanYup'ikZimbabwean
Immigration
NonimmigrantsImmigrantsAfghanistanAfricaAlbaniaArgentinaArmeniaAsiaAustraliaAustriaBahamasBangladeshBarbadosBelarusBelgiumBelizeBoliviaBosnia and HerzegovinaBrazilBulgariaBurma/MyanmarCabo VerdeCambodiaCameroonCanadaCaribbeanCentral AmericaChileChinaColombiaCongoCosta RicaCroatiaCubaCzechoslovakiaDenmarkDominicaDominican RepublicEastern AfricaEastern AsiaEastern EuropeEcuadorEgyptEl SalvadorEnglandEritreaEthiopiaEuropeFijiFranceGermanyGhanaGreeceGrenadaGuatemalaGuyanaHaitiHondurasHong KongHungaryIndiaIndonesiaIranIraqIrelandIsraelItalyJamaicaJapanJordanKazakhstanKenyaKoreaKuwaitLaosLatin AmericaLatviaLebanonLiberiaLithuaniaMalaysiaMexicoMicronesiaMiddle AfricaMoldovaMoroccoNepalNetherlandsNicaraguaNigeriaNorth AmericaNorth MacedoniaNorthern AfricaNorthern EuropeNorwayOceaniaPakistanPanamaPeruPhilippinesPolandPortugalRomaniaRussiaSaudi ArabiaScotlandSenegalSerbiaSierra LeoneSingaporeSomaliaSouth AfricaSouth AmericaSouth Central AsiaSouth Eastern AsiaSouthern EuropeSpainSri LankaSt. Vincent and the GrenadinesSudanSwedenSwitzerlandSyriaTaiwanThailandTrinidad and TobagoTurkeyUgandaUkraineUruguayUzbekistanVenezuelaVietnamWest IndiesWestern AfricaWestern AsiaWestern EuropeYemenZaireZimbabweAzores
Select to Compare
Race
Ancestry
AfghanAfricanAlaska NativeAlaskan AthabascanAlbanianAleutAlsatianAmericanApacheArabArapahoArgentineanArmenianAssyrian/Chaldean/SyriacAustralianAustrianBahamianBangladeshiBarbadianBasqueBelgianBelizeanBermudanBhutaneseBlackfeetBolivianBrazilianBritishBritish West IndianBulgarianBurmeseCajunCambodianCanadianCape VerdeanCarpatho RusynCelticCentral AmericanCentral American IndianCherokeeCheyenneChickasawChileanChineseChippewaChoctawColombianColvilleComancheCosta RicanCreeCreekCroatianCrowCubanCypriotCzechCzechoslovakianDanishDelawareDominicanDutchDutch West IndianEastern EuropeanEcuadorianEgyptianEnglishEstonianEthiopianEuropeanFijianFilipinoFinnishFrenchFrench American IndianFrench CanadianGermanGerman RussianGhanaianGreekGuamanian/ChamorroGuatemalanGuyaneseHaitianHmongHonduranHopiHoumaHungarianIcelanderIndian (Asian)IndonesianInupiatIranianIraqiIrishIroquoisIsraeliItalianJamaicanJapaneseJordanianKenyanKiowaKoreanLaotianLatvianLebaneseLiberianLithuanianLumbeeLuxembourgerMacedonianMalaysianMalteseMarshalleseMenomineeMexicanMexican American IndianMongolianNative HawaiianNavajoNepaleseNew ZealanderNicaraguanNigerianNorthern EuropeanNorwegianOkinawanOsageOttawaPaiutePakistaniPalestinianPanamanianParaguayanPennsylvania GermanPeruvianPimaPolishPortuguesePotawatomiPuebloPuerto RicanPuget Sound SalishRomanianRussianSalvadoranSamoanScandinavianScotch-IrishScottishSeminoleSenegaleseSerbianShoshoneSierra LeoneanSiouxSlavicSlovakSloveneSomaliSouth AfricanSouth AmericanSouth American IndianSoviet UnionSpaniardSpanishSpanish AmericanSpanish American IndianSri LankanSubsaharan AfricanSudaneseSwedishSwissSyrianTaiwaneseThaiTlingit-HaidaTohono O'OdhamTonganTrinidadian and TobagonianTsimshianTurkishU.S. Virgin IslanderUgandanUkrainianUruguayanUteVenezuelanVietnameseWelshWest IndianYakamaYaquiYugoslavianYumanYup'ikZimbabwean
Immigration
NonimmigrantsImmigrantsAfghanistanAfricaAlbaniaArgentinaArmeniaAsiaAustraliaAustriaBahamasBangladeshBarbadosBelarusBelgiumBelizeBoliviaBosnia and HerzegovinaBrazilBulgariaBurma/MyanmarCabo VerdeCambodiaCameroonCanadaCaribbeanCentral AmericaChileChinaColombiaCongoCosta RicaCroatiaCubaCzechoslovakiaDenmarkDominicaDominican RepublicEastern AfricaEastern AsiaEastern EuropeEcuadorEgyptEl SalvadorEnglandEritreaEthiopiaEuropeFijiFranceGermanyGhanaGreeceGrenadaGuatemalaGuyanaHaitiHondurasHong KongHungaryIndiaIndonesiaIranIraqIrelandIsraelItalyJamaicaJapanJordanKazakhstanKenyaKoreaKuwaitLaosLatin AmericaLatviaLebanonLiberiaLithuaniaMalaysiaMexicoMicronesiaMiddle AfricaMoldovaMoroccoNepalNetherlandsNicaraguaNigeriaNorth AmericaNorth MacedoniaNorthern AfricaNorthern EuropeNorwayOceaniaPakistanPanamaPeruPhilippinesPolandPortugalRomaniaRussiaSaudi ArabiaScotlandSenegalSerbiaSierra LeoneSingaporeSomaliaSouth AfricaSouth AmericaSouth Central AsiaSouth Eastern AsiaSouthern EuropeSpainSri LankaSt. Vincent and the GrenadinesSudanSwedenSwitzerlandSyriaTaiwanThailandTrinidad and TobagoTurkeyUgandaUkraineUruguayUzbekistanVenezuelaVietnamWest IndiesWestern AfricaWestern AsiaWestern EuropeYemenZaireZimbabweAzores
Married-Couple Family Poverty
Income
Poverty
Unemployment
Labor Participation
Family Structure
Vehicle Availability
Education Level
Disability

Moroccan Married-Couple Family Poverty
Tragic

5.7%
POVERTY | MARRIED-COUPLE FAMILIES
4.9/ 100
METRIC RATING
230th/ 347
METRIC RANK

Moroccan Married-Couple Family Poverty Correlation Chart

The statistical analysis conducted on geographies consisting of 200,993,893 people shows a mild positive correlation between the proportion of Moroccans and poverty level among married-couple families in the United States with a correlation coefficient (R) of 0.381 and weighted average of 5.7%. On average, for every 1% (one percent) increase in Moroccans within a typical geography, there is an increase of 0.46% in poverty level among married-couple families.
Moroccan Married-Couple Family Poverty
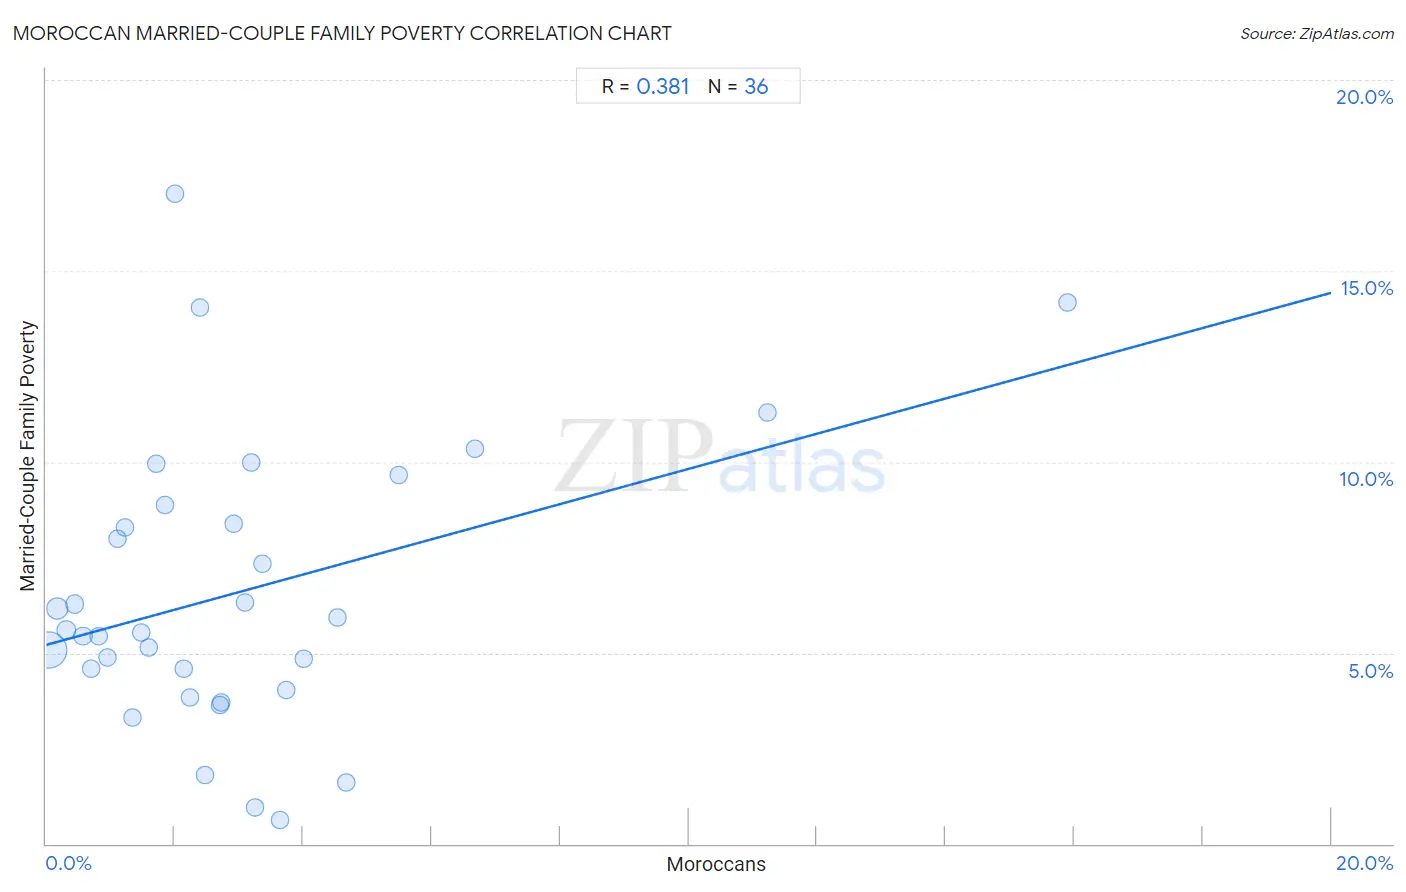
It is essential to understand that the correlation between the percentage of Moroccans and poverty level among married-couple families does not imply a direct cause-and-effect relationship. It remains uncertain whether the presence of Moroccans influences an upward or downward trend in the level of poverty level among married-couple families within an area, or if Moroccans simply ended up residing in those areas with higher or lower levels of poverty level among married-couple families due to other factors.

Demographics Similar to Moroccans by Married-Couple Family Poverty

In terms of married-couple family poverty, the demographic groups most similar to Moroccans are Subsaharan African (5.7%, a difference of 0.030%), Immigrants from Iraq (5.7%, a difference of 0.26%), Arab (5.7%, a difference of 0.28%), Immigrants from Laos (5.7%, a difference of 0.32%), and Immigrants from Zaire (5.6%, a difference of 0.41%).
DemographicsRating | RankMarried-Couple Family Poverty
Immigrants from Fiji
6.7
/100
|
#223
Tragic
5.6%
Sudanese
6.4
/100
|
#224
Tragic
5.6%
Immigrants from Cambodia
6.1
/100
|
#225
Tragic
5.6%
South Americans
5.7
/100
|
#226
Tragic
5.6%
Immigrants from Zaire
5.6
/100
|
#227
Tragic
5.6%
Arabs
5.4
/100
|
#228
Tragic
5.7%
Sub-Saharan Africans
4.9
/100
|
#229
Tragic
5.7%
Moroccans
4.9
/100
|
#230
Tragic
5.7%
Immigrants from Iraq
4.4
/100
|
#231
Tragic
5.7%
Immigrants from Laos
4.4
/100
|
#232
Tragic
5.7%
Immigrants from Colombia
3.7
/100
|
#233
Tragic
5.7%
Immigrants from Uruguay
3.7
/100
|
#234
Tragic
5.7%
Immigrants from Sudan
3.5
/100
|
#235
Tragic
5.7%
Ghanaians
3.3
/100
|
#236
Tragic
5.7%
Immigrants from South America
3.1
/100
|
#237
Tragic
5.7%

Moroccan Married-Couple Family Poverty Correlation Summary

MeasurementMoroccan DataMarried-Couple Family Poverty Data
Minimum0.046%0.64%
Maximum15.9%17.0%
Range15.8%16.4%
Mean3.0%6.6%
Median2.3%5.6%
Interquartile 25% (IQ1)1.2%4.3%
Interquartile 75% (IQ3)3.5%8.6%
Interquartile Range (IQR)2.3%4.3%
Standard Deviation (Sample)3.1%3.7%
Standard Deviation (Population)3.0%3.7%

Correlation Details

Moroccan PercentileSample SizeMarried-Couple Family Poverty
[
0.0%
-
0.5%
]
0.046%
147,419,9985.1%
[
0.0%
-
0.5%
]
0.17%
33,238,3066.2%
[
0.0%
-
0.5%
]
0.31%
8,701,4995.6%
[
0.0%
-
0.5%
]
0.44%
4,289,5586.3%
[
0.5%
-
1.0%
]
0.57%
2,351,7715.5%
[
0.5%
-
1.0%
]
0.70%
1,607,2214.6%
[
0.5%
-
1.0%
]
0.82%
1,043,5325.4%
[
0.5%
-
1.0%
]
0.95%
552,6764.9%
[
1.0%
-
1.5%
]
1.10%
265,6758.0%
[
1.0%
-
1.5%
]
1.22%
466,7908.3%
[
1.0%
-
1.5%
]
1.34%
118,7273.3%
[
1.0%
-
1.5%
]
1.48%
248,0655.5%
[
1.5%
-
2.0%
]
1.59%
132,2995.2%
[
1.5%
-
2.0%
]
1.71%
9,1419.9%
[
1.5%
-
2.0%
]
1.85%
113,2348.9%
[
2.0%
-
2.5%
]
2.00%
8,04717.0%
[
2.0%
-
2.5%
]
2.14%
63,6854.6%
[
2.0%
-
2.5%
]
2.23%
212,0863.8%
[
2.0%
-
2.5%
]
2.39%
37,06514.1%
[
2.0%
-
2.5%
]
2.48%
8,1091.8%
[
2.5%
-
3.0%
]
2.70%
5,6293.6%
[
2.5%
-
3.0%
]
2.73%
31,7713.7%
[
2.5%
-
3.0%
]
2.91%
9,0238.4%
[
3.0%
-
3.5%
]
3.09%
5,9176.3%
[
3.0%
-
3.5%
]
3.19%
18810.0%
[
3.0%
-
3.5%
]
3.24%
5,1850.95%
[
3.0%
-
3.5%
]
3.37%
19,5317.3%
[
3.5%
-
4.0%
]
3.63%
8,2070.64%
[
3.5%
-
4.0%
]
3.74%
9354.0%
[
4.0%
-
4.5%
]
4.00%
8244.8%
[
4.5%
-
5.0%
]
4.52%
6,1235.9%
[
4.5%
-
5.0%
]
4.67%
2,5081.6%
[
5.0%
-
5.5%
]
5.48%
2,4999.7%
[
6.5%
-
7.0%
]
6.67%
46510.3%
[
11.0%
-
11.5%
]
11.23%
6,96211.3%
[
15.5%
-
16.0%
]
15.89%
64214.2%