Immigrants from Cambodia Married-Couple Family Poverty
COMPARE
Immigrants from Cambodia
Select to Compare
Married-Couple Family Poverty
Immigrants from Cambodia Married-Couple Family Poverty
5.6%
POVERTY | MARRIED-COUPLE FAMILIES
6.1/ 100
METRIC RATING
225th/ 347
METRIC RANK
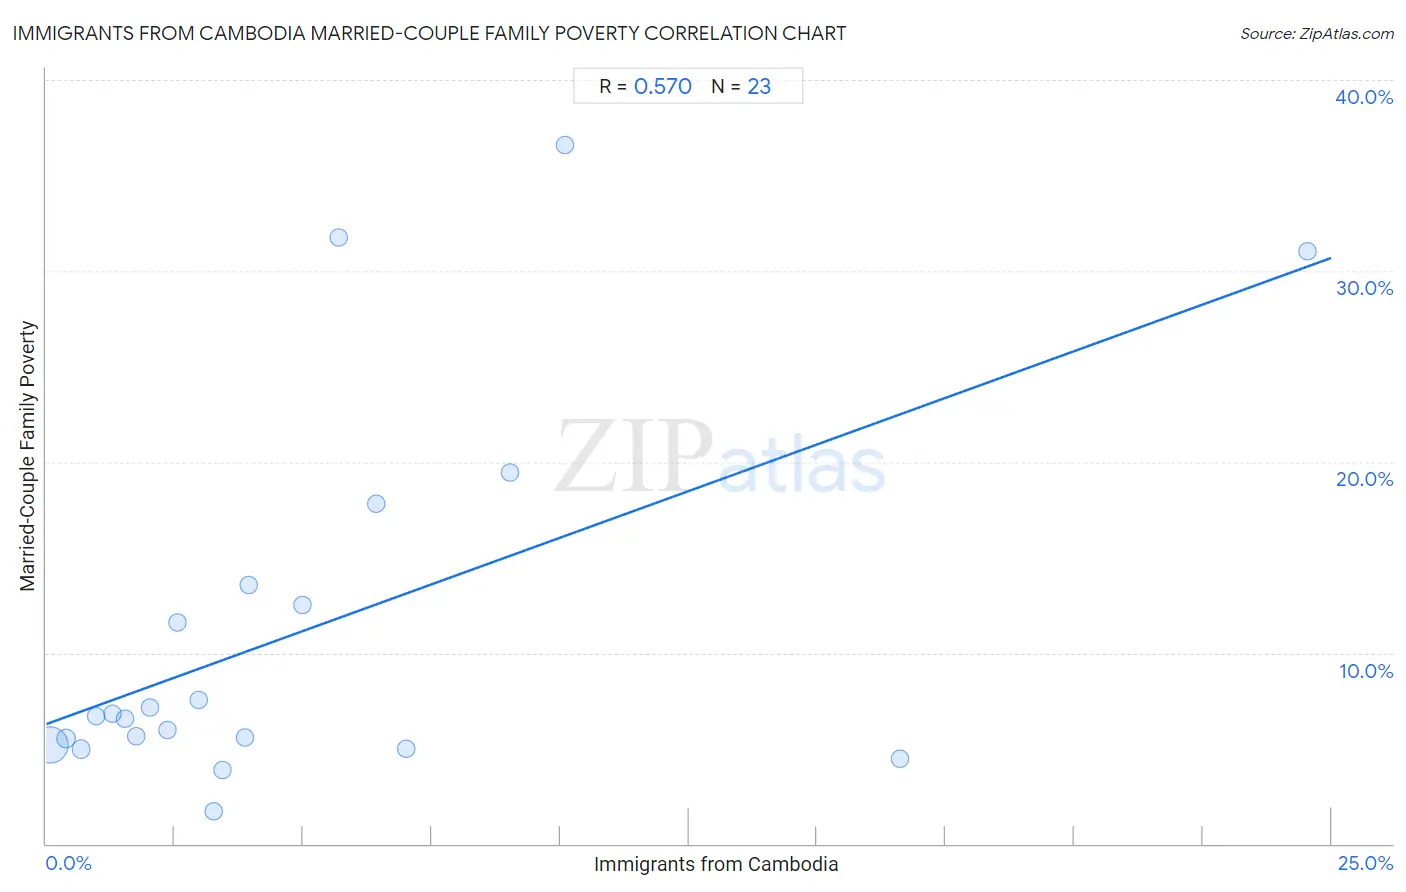
Immigrants from Cambodia Married-Couple Family Poverty Correlation Chart
The statistical analysis conducted on geographies consisting of 204,385,428 people shows a substantial positive correlation between the proportion of Immigrants from Cambodia and poverty level among married-couple families in the United States with a correlation coefficient (R) of 0.570 and weighted average of 5.6%. On average, for every 1% (one percent) increase in Immigrants from Cambodia within a typical geography, there is an increase of 0.98% in poverty level among married-couple families.
It is essential to understand that the correlation between the percentage of Immigrants from Cambodia and poverty level among married-couple families does not imply a direct cause-and-effect relationship. It remains uncertain whether the presence of Immigrants from Cambodia influences an upward or downward trend in the level of poverty level among married-couple families within an area, or if Immigrants from Cambodia simply ended up residing in those areas with higher or lower levels of poverty level among married-couple families due to other factors.
Demographics Similar to Immigrants from Cambodia by Married-Couple Family Poverty
In terms of married-couple family poverty, the demographic groups most similar to Immigrants from Cambodia are Sudanese (5.6%, a difference of 0.14%), South American (5.6%, a difference of 0.22%), Immigrants from Zaire (5.6%, a difference of 0.24%), Immigrants from Fiji (5.6%, a difference of 0.25%), and Cajun (5.6%, a difference of 0.32%).
| Demographics | Rating | Rank | Married-Couple Family Poverty |
| Afghans | 11.2 /100 | #218 | Poor 5.5% |
| Japanese | 9.8 /100 | #219 | Tragic 5.6% |
| Colombians | 9.2 /100 | #220 | Tragic 5.6% |
| Panamanians | 9.2 /100 | #221 | Tragic 5.6% |
| Cajuns | 6.9 /100 | #222 | Tragic 5.6% |
| Immigrants from Fiji | 6.7 /100 | #223 | Tragic 5.6% |
| Sudanese | 6.4 /100 | #224 | Tragic 5.6% |
| Immigrants from Cambodia | 6.1 /100 | #225 | Tragic 5.6% |
| South Americans | 5.7 /100 | #226 | Tragic 5.6% |
| Immigrants from Zaire | 5.6 /100 | #227 | Tragic 5.6% |
| Arabs | 5.4 /100 | #228 | Tragic 5.7% |
| Sub-Saharan Africans | 4.9 /100 | #229 | Tragic 5.7% |
| Moroccans | 4.9 /100 | #230 | Tragic 5.7% |
| Immigrants from Iraq | 4.4 /100 | #231 | Tragic 5.7% |
| Immigrants from Laos | 4.4 /100 | #232 | Tragic 5.7% |
Immigrants from Cambodia Married-Couple Family Poverty Correlation Summary
| Measurement | Immigrants from Cambodia Data | Married-Couple Family Poverty Data |
| Minimum | 0.067% | 1.7% |
| Maximum | 24.5% | 36.6% |
| Range | 24.5% | 34.9% |
| Mean | 5.0% | 11.2% |
| Median | 3.3% | 6.7% |
| Interquartile 25% (IQ1) | 1.5% | 5.2% |
| Interquartile 75% (IQ3) | 6.4% | 13.6% |
| Interquartile Range (IQR) | 4.9% | 8.4% |
| Standard Deviation (Sample) | 5.7% | 9.8% |
| Standard Deviation (Population) | 5.6% | 9.6% |
Correlation Details
| Immigrants from Cambodia Percentile | Sample Size | Married-Couple Family Poverty |
[ 0.0% - 0.5% ] 0.067% | 180,324,443 | 5.2% |
[ 0.0% - 0.5% ] 0.38% | 16,082,461 | 5.5% |
[ 0.5% - 1.0% ] 0.67% | 3,911,708 | 4.9% |
[ 0.5% - 1.0% ] 0.96% | 1,694,530 | 6.7% |
[ 1.0% - 1.5% ] 1.30% | 754,357 | 6.8% |
[ 1.5% - 2.0% ] 1.54% | 220,552 | 6.5% |
[ 1.5% - 2.0% ] 1.76% | 539,969 | 5.6% |
[ 2.0% - 2.5% ] 2.02% | 176,237 | 7.1% |
[ 2.0% - 2.5% ] 2.36% | 93,738 | 6.0% |
[ 2.5% - 3.0% ] 2.56% | 171,177 | 11.6% |
[ 2.5% - 3.0% ] 2.96% | 109,748 | 7.6% |
[ 3.0% - 3.5% ] 3.27% | 795 | 1.7% |
[ 3.0% - 3.5% ] 3.43% | 69,995 | 3.9% |
[ 3.5% - 4.0% ] 3.86% | 26,429 | 5.6% |
[ 3.5% - 4.0% ] 3.95% | 53,647 | 13.6% |
[ 4.5% - 5.0% ] 4.99% | 1,063 | 12.5% |
[ 5.5% - 6.0% ] 5.68% | 2,588 | 31.8% |
[ 6.0% - 6.5% ] 6.41% | 2,215 | 17.8% |
[ 7.0% - 7.5% ] 7.00% | 114,737 | 5.0% |
[ 9.0% - 9.5% ] 9.02% | 1,575 | 19.5% |
[ 10.0% - 10.5% ] 10.10% | 921 | 36.6% |
[ 16.5% - 17.0% ] 16.60% | 32,323 | 4.5% |
[ 24.5% - 25.0% ] 24.55% | 220 | 31.0% |