Immigrants from Serbia Married-Couple Family Poverty
COMPARE
Immigrants from Serbia
Select to Compare
Married-Couple Family Poverty
Immigrants from Serbia Married-Couple Family Poverty
4.4%
POVERTY | MARRIED-COUPLE FAMILIES
99.4/ 100
METRIC RATING
66th/ 347
METRIC RANK
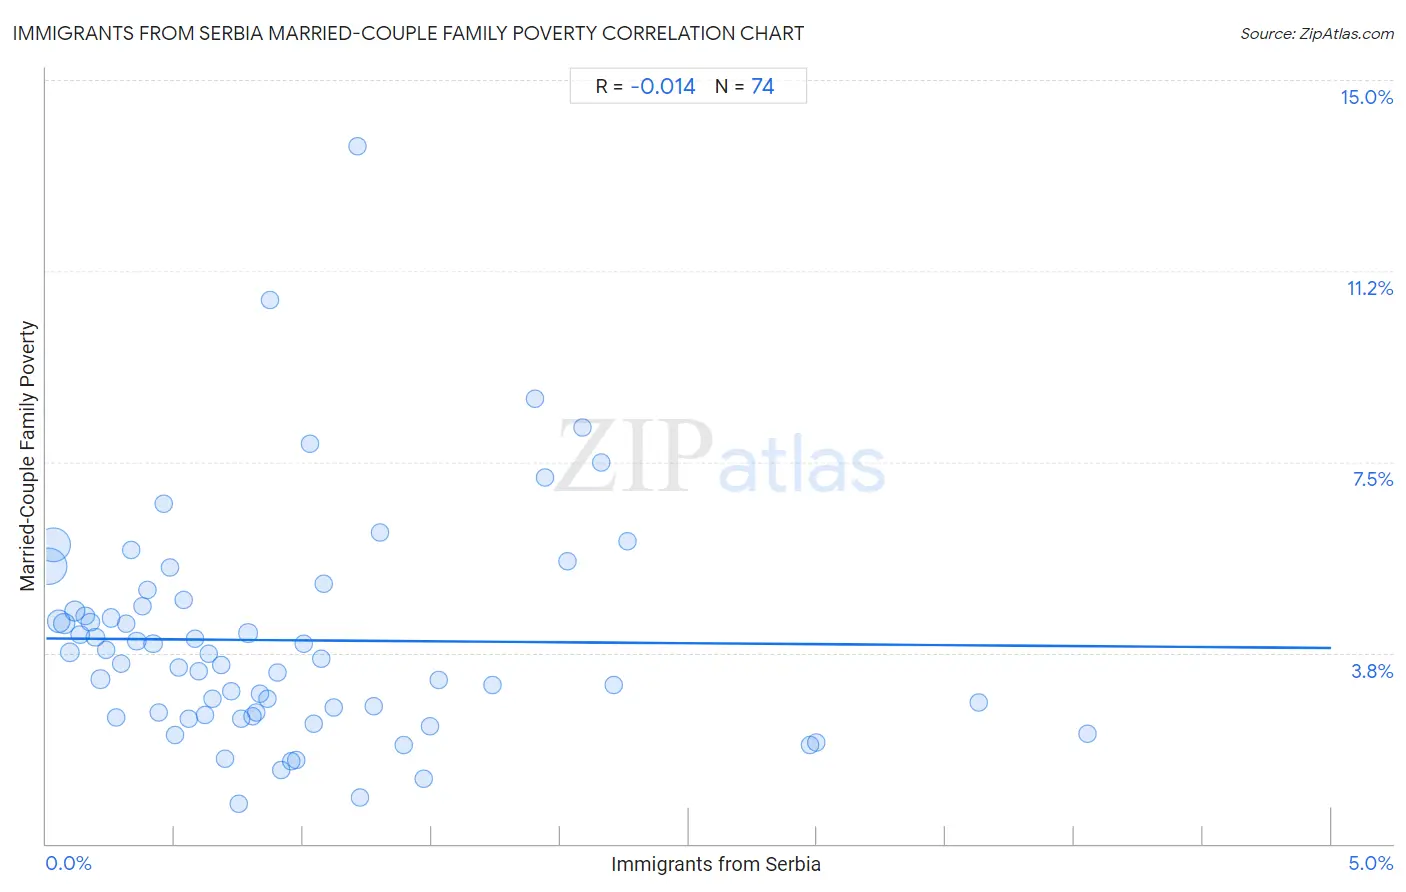
Immigrants from Serbia Married-Couple Family Poverty Correlation Chart
The statistical analysis conducted on geographies consisting of 131,455,984 people shows no correlation between the proportion of Immigrants from Serbia and poverty level among married-couple families in the United States with a correlation coefficient (R) of -0.014 and weighted average of 4.4%. On average, for every 1% (one percent) increase in Immigrants from Serbia within a typical geography, there is a decrease of 0.037% in poverty level among married-couple families.
It is essential to understand that the correlation between the percentage of Immigrants from Serbia and poverty level among married-couple families does not imply a direct cause-and-effect relationship. It remains uncertain whether the presence of Immigrants from Serbia influences an upward or downward trend in the level of poverty level among married-couple families within an area, or if Immigrants from Serbia simply ended up residing in those areas with higher or lower levels of poverty level among married-couple families due to other factors.
Demographics Similar to Immigrants from Serbia by Married-Couple Family Poverty
In terms of married-couple family poverty, the demographic groups most similar to Immigrants from Serbia are Immigrants from Canada (4.4%, a difference of 0.050%), Slavic (4.4%, a difference of 0.060%), New Zealander (4.4%, a difference of 0.070%), Macedonian (4.4%, a difference of 0.13%), and Immigrants from Korea (4.5%, a difference of 0.20%).
| Demographics | Rating | Rank | Married-Couple Family Poverty |
| Immigrants from Sweden | 99.6 /100 | #59 | Exceptional 4.4% |
| Tlingit-Haida | 99.6 /100 | #60 | Exceptional 4.4% |
| Okinawans | 99.6 /100 | #61 | Exceptional 4.4% |
| Immigrants from Australia | 99.6 /100 | #62 | Exceptional 4.4% |
| Immigrants from Sri Lanka | 99.6 /100 | #63 | Exceptional 4.4% |
| Immigrants from Bulgaria | 99.5 /100 | #64 | Exceptional 4.4% |
| Macedonians | 99.4 /100 | #65 | Exceptional 4.4% |
| Immigrants from Serbia | 99.4 /100 | #66 | Exceptional 4.4% |
| Immigrants from Canada | 99.4 /100 | #67 | Exceptional 4.4% |
| Slavs | 99.4 /100 | #68 | Exceptional 4.4% |
| New Zealanders | 99.4 /100 | #69 | Exceptional 4.4% |
| Immigrants from Korea | 99.4 /100 | #70 | Exceptional 4.5% |
| Immigrants from North America | 99.3 /100 | #71 | Exceptional 4.5% |
| Immigrants from England | 99.3 /100 | #72 | Exceptional 4.5% |
| Ukrainians | 99.2 /100 | #73 | Exceptional 4.5% |
Immigrants from Serbia Married-Couple Family Poverty Correlation Summary
| Measurement | Immigrants from Serbia Data | Married-Couple Family Poverty Data |
| Minimum | 0.0098% | 0.78% |
| Maximum | 4.0% | 13.7% |
| Range | 4.0% | 12.9% |
| Mean | 0.95% | 4.0% |
| Median | 0.75% | 3.6% |
| Interquartile 25% (IQ1) | 0.37% | 2.5% |
| Interquartile 75% (IQ3) | 1.2% | 4.7% |
| Interquartile Range (IQR) | 0.85% | 2.2% |
| Standard Deviation (Sample) | 0.83% | 2.2% |
| Standard Deviation (Population) | 0.83% | 2.2% |
Correlation Details
| Immigrants from Serbia Percentile | Sample Size | Married-Couple Family Poverty |
[ 0.0% - 0.5% ] 0.0098% | 46,383,050 | 5.5% |
[ 0.0% - 0.5% ] 0.030% | 41,113,529 | 5.9% |
[ 0.0% - 0.5% ] 0.049% | 12,276,128 | 4.4% |
[ 0.0% - 0.5% ] 0.070% | 7,138,205 | 4.3% |
[ 0.0% - 0.5% ] 0.090% | 3,867,416 | 3.8% |
[ 0.0% - 0.5% ] 0.11% | 7,147,834 | 4.6% |
[ 0.0% - 0.5% ] 0.13% | 2,151,642 | 4.1% |
[ 0.0% - 0.5% ] 0.15% | 1,881,213 | 4.5% |
[ 0.0% - 0.5% ] 0.17% | 1,380,801 | 4.3% |
[ 0.0% - 0.5% ] 0.19% | 1,260,686 | 4.1% |
[ 0.0% - 0.5% ] 0.21% | 990,886 | 3.2% |
[ 0.0% - 0.5% ] 0.23% | 659,659 | 3.8% |
[ 0.0% - 0.5% ] 0.25% | 849,501 | 4.4% |
[ 0.0% - 0.5% ] 0.27% | 249,503 | 2.5% |
[ 0.0% - 0.5% ] 0.29% | 437,966 | 3.5% |
[ 0.0% - 0.5% ] 0.31% | 222,054 | 4.3% |
[ 0.0% - 0.5% ] 0.33% | 189,410 | 5.8% |
[ 0.0% - 0.5% ] 0.35% | 601,994 | 4.0% |
[ 0.0% - 0.5% ] 0.37% | 155,593 | 4.7% |
[ 0.0% - 0.5% ] 0.39% | 368,234 | 5.0% |
[ 0.0% - 0.5% ] 0.42% | 153,932 | 3.9% |
[ 0.0% - 0.5% ] 0.44% | 92,458 | 2.6% |
[ 0.0% - 0.5% ] 0.46% | 134,989 | 6.7% |
[ 0.0% - 0.5% ] 0.48% | 173,834 | 5.4% |
[ 0.0% - 0.5% ] 0.50% | 87,010 | 2.1% |
[ 0.5% - 1.0% ] 0.51% | 72,799 | 3.5% |
[ 0.5% - 1.0% ] 0.54% | 207,021 | 4.8% |
[ 0.5% - 1.0% ] 0.55% | 10,281 | 2.5% |
[ 0.5% - 1.0% ] 0.58% | 24,340 | 4.0% |
[ 0.5% - 1.0% ] 0.59% | 98,522 | 3.4% |
[ 0.5% - 1.0% ] 0.62% | 59,935 | 2.5% |
[ 0.5% - 1.0% ] 0.63% | 127,522 | 3.7% |
[ 0.5% - 1.0% ] 0.65% | 15,275 | 2.9% |
[ 0.5% - 1.0% ] 0.68% | 56,107 | 3.5% |
[ 0.5% - 1.0% ] 0.70% | 69,100 | 1.7% |
[ 0.5% - 1.0% ] 0.72% | 90,959 | 3.0% |
[ 0.5% - 1.0% ] 0.75% | 801 | 0.78% |
[ 0.5% - 1.0% ] 0.76% | 74,549 | 2.5% |
[ 0.5% - 1.0% ] 0.79% | 110,012 | 4.1% |
[ 0.5% - 1.0% ] 0.80% | 15,291 | 2.5% |
[ 0.5% - 1.0% ] 0.82% | 94,754 | 2.6% |
[ 0.5% - 1.0% ] 0.83% | 4,080 | 3.0% |
[ 0.5% - 1.0% ] 0.86% | 59,624 | 2.8% |
[ 0.5% - 1.0% ] 0.87% | 1,604 | 10.7% |
[ 0.5% - 1.0% ] 0.90% | 18,245 | 3.4% |
[ 0.5% - 1.0% ] 0.91% | 11,929 | 1.5% |
[ 0.5% - 1.0% ] 0.95% | 21,434 | 1.6% |
[ 0.5% - 1.0% ] 0.97% | 20,940 | 1.7% |
[ 1.0% - 1.5% ] 1.00% | 299 | 3.9% |
[ 1.0% - 1.5% ] 1.03% | 6,432 | 7.9% |
[ 1.0% - 1.5% ] 1.04% | 6,444 | 2.4% |
[ 1.0% - 1.5% ] 1.07% | 15,861 | 3.6% |
[ 1.0% - 1.5% ] 1.08% | 40,554 | 5.1% |
[ 1.0% - 1.5% ] 1.12% | 1,785 | 2.7% |
[ 1.0% - 1.5% ] 1.21% | 1,156 | 13.7% |
[ 1.0% - 1.5% ] 1.22% | 5,651 | 0.92% |
[ 1.0% - 1.5% ] 1.27% | 9,977 | 2.7% |
[ 1.0% - 1.5% ] 1.30% | 5,775 | 6.1% |
[ 1.0% - 1.5% ] 1.39% | 31,647 | 1.9% |
[ 1.0% - 1.5% ] 1.47% | 13,070 | 1.3% |
[ 1.0% - 1.5% ] 1.49% | 7,228 | 2.3% |
[ 1.5% - 2.0% ] 1.53% | 35,112 | 3.2% |
[ 1.5% - 2.0% ] 1.73% | 173 | 3.1% |
[ 1.5% - 2.0% ] 1.90% | 946 | 8.7% |
[ 1.5% - 2.0% ] 1.94% | 21,357 | 7.2% |
[ 2.0% - 2.5% ] 2.03% | 936 | 5.6% |
[ 2.0% - 2.5% ] 2.09% | 766 | 8.2% |
[ 2.0% - 2.5% ] 2.16% | 1,066 | 7.5% |
[ 2.0% - 2.5% ] 2.21% | 317 | 3.1% |
[ 2.0% - 2.5% ] 2.26% | 398 | 5.9% |
[ 2.5% - 3.0% ] 2.97% | 6,322 | 1.9% |
[ 2.5% - 3.0% ] 3.00% | 5,471 | 2.0% |
[ 3.5% - 4.0% ] 3.63% | 4,022 | 2.8% |
[ 4.0% - 4.5% ] 4.05% | 568 | 2.2% |