Immigrants from Haiti Married-Couple Family Poverty
COMPARE
Immigrants from Haiti
Select to Compare
Married-Couple Family Poverty
Immigrants from Haiti Married-Couple Family Poverty
7.0%
POVERTY | MARRIED-COUPLE FAMILIES
0.0/ 100
METRIC RATING
306th/ 347
METRIC RANK
Immigrants from Haiti Married-Couple Family Poverty Correlation Chart
The statistical analysis conducted on geographies consisting of 224,016,924 people shows a mild positive correlation between the proportion of Immigrants from Haiti and poverty level among married-couple families in the United States with a correlation coefficient (R) of 0.344 and weighted average of 7.0%. On average, for every 1% (one percent) increase in Immigrants from Haiti within a typical geography, there is an increase of 0.15% in poverty level among married-couple families.
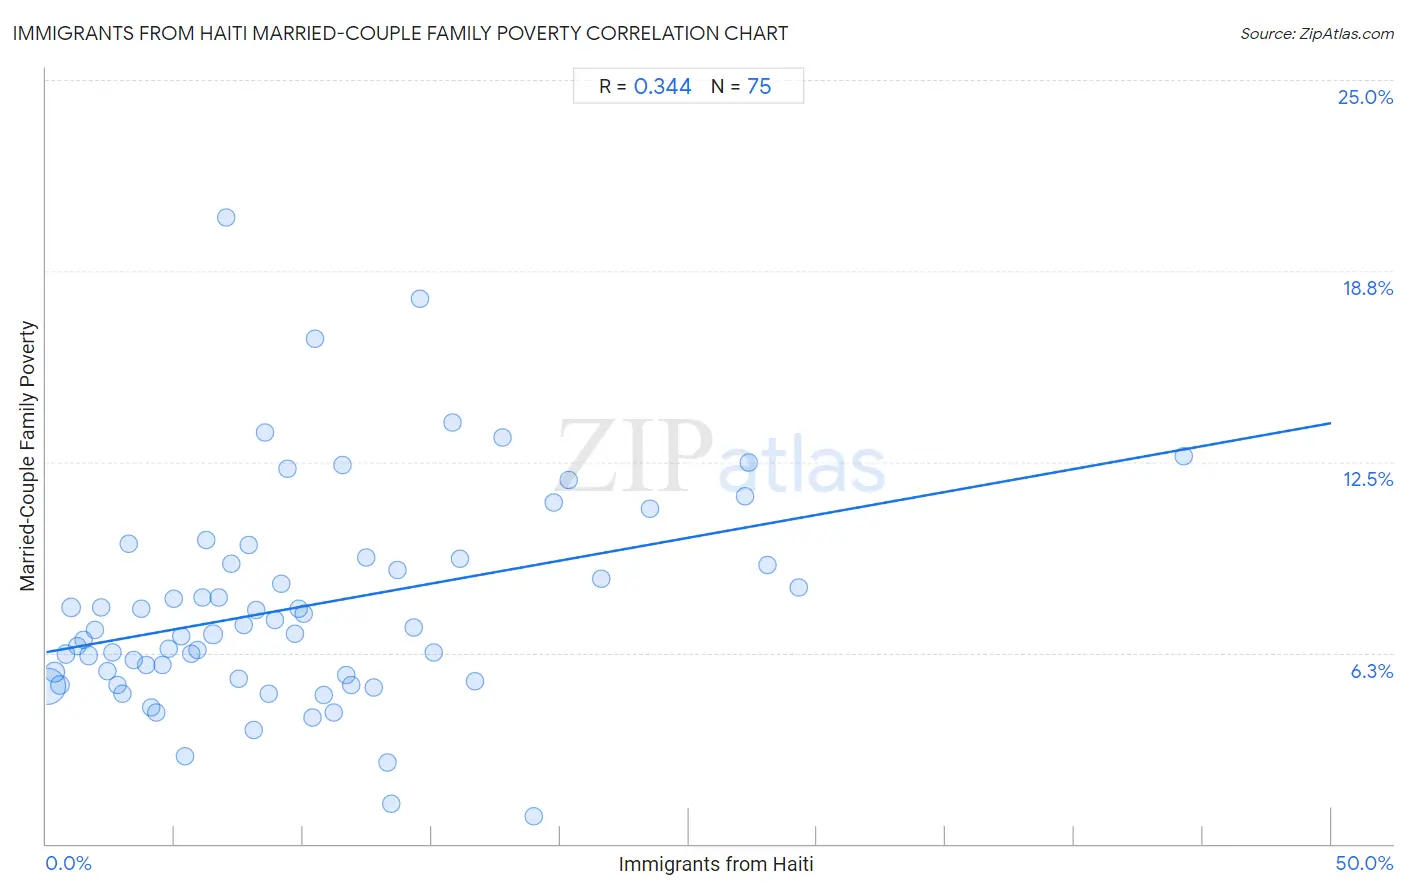
It is essential to understand that the correlation between the percentage of Immigrants from Haiti and poverty level among married-couple families does not imply a direct cause-and-effect relationship. It remains uncertain whether the presence of Immigrants from Haiti influences an upward or downward trend in the level of poverty level among married-couple families within an area, or if Immigrants from Haiti simply ended up residing in those areas with higher or lower levels of poverty level among married-couple families due to other factors.
Demographics Similar to Immigrants from Haiti by Married-Couple Family Poverty
In terms of married-couple family poverty, the demographic groups most similar to Immigrants from Haiti are Guatemalan (7.0%, a difference of 1.1%), Spanish American Indian (7.1%, a difference of 1.3%), Hopi (7.1%, a difference of 1.9%), Immigrants from Nicaragua (7.1%, a difference of 1.9%), and Immigrants from Dominica (7.1%, a difference of 2.0%).
| Demographics | Rating | Rank | Married-Couple Family Poverty |
| Nicaraguans | 0.0 /100 | #299 | Tragic 6.7% |
| Immigrants from Belize | 0.0 /100 | #300 | Tragic 6.7% |
| Central Americans | 0.0 /100 | #301 | Tragic 6.7% |
| Immigrants from Ecuador | 0.0 /100 | #302 | Tragic 6.7% |
| Immigrants from El Salvador | 0.0 /100 | #303 | Tragic 6.8% |
| Cubans | 0.0 /100 | #304 | Tragic 6.8% |
| Haitians | 0.0 /100 | #305 | Tragic 6.8% |
| Immigrants from Haiti | 0.0 /100 | #306 | Tragic 7.0% |
| Guatemalans | 0.0 /100 | #307 | Tragic 7.0% |
| Spanish American Indians | 0.0 /100 | #308 | Tragic 7.1% |
| Hopi | 0.0 /100 | #309 | Tragic 7.1% |
| Immigrants from Nicaragua | 0.0 /100 | #310 | Tragic 7.1% |
| Immigrants from Dominica | 0.0 /100 | #311 | Tragic 7.1% |
| Immigrants from Armenia | 0.0 /100 | #312 | Tragic 7.1% |
| Immigrants from St. Vincent and the Grenadines | 0.0 /100 | #313 | Tragic 7.1% |
Immigrants from Haiti Married-Couple Family Poverty Correlation Summary
| Measurement | Immigrants from Haiti Data | Married-Couple Family Poverty Data |
| Minimum | 0.058% | 0.90% |
| Maximum | 44.3% | 20.5% |
| Range | 44.2% | 19.6% |
| Mean | 10.0% | 7.8% |
| Median | 8.2% | 7.0% |
| Interquartile 25% (IQ1) | 4.1% | 5.4% |
| Interquartile 75% (IQ3) | 13.4% | 9.3% |
| Interquartile Range (IQR) | 9.4% | 4.0% |
| Standard Deviation (Sample) | 8.1% | 3.5% |
| Standard Deviation (Population) | 8.1% | 3.5% |
Correlation Details
| Immigrants from Haiti Percentile | Sample Size | Married-Couple Family Poverty |
[ 0.0% - 0.5% ] 0.058% | 149,258,311 | 5.2% |
[ 0.0% - 0.5% ] 0.32% | 25,431,711 | 5.6% |
[ 0.5% - 1.0% ] 0.55% | 10,764,003 | 5.2% |
[ 0.5% - 1.0% ] 0.76% | 5,284,920 | 6.2% |
[ 0.5% - 1.0% ] 0.96% | 11,566,470 | 7.7% |
[ 1.0% - 1.5% ] 1.21% | 2,328,312 | 6.5% |
[ 1.0% - 1.5% ] 1.44% | 2,337,042 | 6.7% |
[ 1.5% - 2.0% ] 1.66% | 1,781,227 | 6.2% |
[ 1.5% - 2.0% ] 1.90% | 1,279,251 | 7.0% |
[ 2.0% - 2.5% ] 2.15% | 1,361,252 | 7.7% |
[ 2.0% - 2.5% ] 2.36% | 1,514,567 | 5.7% |
[ 2.5% - 3.0% ] 2.56% | 1,027,851 | 6.2% |
[ 2.5% - 3.0% ] 2.77% | 438,114 | 5.2% |
[ 2.5% - 3.0% ] 2.97% | 657,426 | 4.9% |
[ 3.0% - 3.5% ] 3.22% | 351,140 | 9.8% |
[ 3.0% - 3.5% ] 3.41% | 548,789 | 6.0% |
[ 3.5% - 4.0% ] 3.68% | 399,608 | 7.7% |
[ 3.5% - 4.0% ] 3.87% | 583,958 | 5.8% |
[ 4.0% - 4.5% ] 4.09% | 703,837 | 4.4% |
[ 4.0% - 4.5% ] 4.26% | 190,277 | 4.3% |
[ 4.5% - 5.0% ] 4.53% | 547,833 | 5.9% |
[ 4.5% - 5.0% ] 4.77% | 434,151 | 6.4% |
[ 4.5% - 5.0% ] 4.96% | 212,103 | 8.0% |
[ 5.0% - 5.5% ] 5.23% | 269,816 | 6.8% |
[ 5.0% - 5.5% ] 5.37% | 195,229 | 2.9% |
[ 5.5% - 6.0% ] 5.66% | 286,316 | 6.2% |
[ 5.5% - 6.0% ] 5.89% | 207,895 | 6.3% |
[ 6.0% - 6.5% ] 6.09% | 164,952 | 8.1% |
[ 6.0% - 6.5% ] 6.25% | 70,245 | 9.9% |
[ 6.0% - 6.5% ] 6.49% | 385,906 | 6.9% |
[ 6.5% - 7.0% ] 6.69% | 60,922 | 8.1% |
[ 6.5% - 7.0% ] 6.99% | 108,023 | 20.5% |
[ 7.0% - 7.5% ] 7.18% | 125,831 | 9.2% |
[ 7.0% - 7.5% ] 7.48% | 99,835 | 5.4% |
[ 7.5% - 8.0% ] 7.66% | 92,012 | 7.2% |
[ 7.5% - 8.0% ] 7.88% | 178,368 | 9.8% |
[ 8.0% - 8.5% ] 8.07% | 27,845 | 3.7% |
[ 8.0% - 8.5% ] 8.20% | 1,928 | 7.6% |
[ 8.5% - 9.0% ] 8.54% | 34,411 | 13.5% |
[ 8.5% - 9.0% ] 8.68% | 46,881 | 4.9% |
[ 8.5% - 9.0% ] 8.91% | 89,129 | 7.3% |
[ 9.0% - 9.5% ] 9.16% | 259,345 | 8.5% |
[ 9.0% - 9.5% ] 9.37% | 4,939 | 12.3% |
[ 9.5% - 10.0% ] 9.66% | 175,517 | 6.9% |
[ 9.5% - 10.0% ] 9.82% | 171,255 | 7.7% |
[ 10.0% - 10.5% ] 10.02% | 316,683 | 7.5% |
[ 10.0% - 10.5% ] 10.38% | 37,829 | 4.1% |
[ 10.0% - 10.5% ] 10.45% | 20,503 | 16.5% |
[ 10.5% - 11.0% ] 10.77% | 138,934 | 4.9% |
[ 11.0% - 11.5% ] 11.18% | 70,829 | 4.3% |
[ 11.5% - 12.0% ] 11.50% | 62,827 | 12.4% |
[ 11.5% - 12.0% ] 11.65% | 234,322 | 5.5% |
[ 11.5% - 12.0% ] 11.86% | 103,175 | 5.2% |
[ 12.0% - 12.5% ] 12.46% | 114,188 | 9.4% |
[ 12.5% - 13.0% ] 12.77% | 109,896 | 5.1% |
[ 13.0% - 13.5% ] 13.26% | 39,498 | 2.6% |
[ 13.0% - 13.5% ] 13.45% | 1,904 | 1.3% |
[ 13.5% - 14.0% ] 13.65% | 7,054 | 9.0% |
[ 14.0% - 14.5% ] 14.32% | 93,515 | 7.1% |
[ 14.5% - 15.0% ] 14.56% | 36,155 | 17.8% |
[ 15.0% - 15.5% ] 15.08% | 8,996 | 6.3% |
[ 15.5% - 16.0% ] 15.82% | 83,221 | 13.8% |
[ 16.0% - 16.5% ] 16.08% | 105,835 | 9.3% |
[ 16.5% - 17.0% ] 16.67% | 37,533 | 5.3% |
[ 17.5% - 18.0% ] 17.78% | 35,914 | 13.3% |
[ 18.5% - 19.0% ] 18.98% | 764 | 0.90% |
[ 19.5% - 20.0% ] 19.73% | 22,823 | 11.2% |
[ 20.0% - 20.5% ] 20.35% | 31,807 | 11.9% |
[ 21.5% - 22.0% ] 21.60% | 48,326 | 8.7% |
[ 23.5% - 24.0% ] 23.50% | 2,974 | 11.0% |
[ 27.0% - 27.5% ] 27.17% | 83,312 | 11.4% |
[ 27.0% - 27.5% ] 27.32% | 34,725 | 12.5% |
[ 28.0% - 28.5% ] 28.08% | 20,030 | 9.1% |
[ 29.0% - 29.5% ] 29.30% | 52,824 | 8.4% |
[ 44.0% - 44.5% ] 44.28% | 1,775 | 12.7% |