Aleut Married-Couple Family Poverty

COMPARE

Aleut
Race
Ancestry
AfghanAfricanAlaska NativeAlaskan AthabascanAlbanianAleutAlsatianAmericanApacheArabArapahoArgentineanArmenianAssyrian/Chaldean/SyriacAustralianAustrianBahamianBangladeshiBarbadianBasqueBelgianBelizeanBermudanBhutaneseBlackfeetBolivianBrazilianBritishBritish West IndianBulgarianBurmeseCajunCambodianCanadianCape VerdeanCarpatho RusynCelticCentral AmericanCentral American IndianCherokeeCheyenneChickasawChileanChineseChippewaChoctawColombianColvilleComancheCosta RicanCreeCreekCroatianCrowCubanCypriotCzechCzechoslovakianDanishDelawareDominicanDutchDutch West IndianEastern EuropeanEcuadorianEgyptianEnglishEstonianEthiopianEuropeanFijianFilipinoFinnishFrenchFrench American IndianFrench CanadianGermanGerman RussianGhanaianGreekGuamanian/ChamorroGuatemalanGuyaneseHaitianHmongHonduranHopiHoumaHungarianIcelanderIndian (Asian)IndonesianInupiatIranianIraqiIrishIroquoisIsraeliItalianJamaicanJapaneseJordanianKenyanKiowaKoreanLaotianLatvianLebaneseLiberianLithuanianLumbeeLuxembourgerMacedonianMalaysianMalteseMarshalleseMenomineeMexicanMexican American IndianMongolianMoroccanNative HawaiianNavajoNepaleseNew ZealanderNicaraguanNigerianNorthern EuropeanNorwegianOkinawanOsageOttawaPaiutePakistaniPalestinianPanamanianParaguayanPennsylvania GermanPeruvianPimaPolishPortuguesePotawatomiPuebloPuerto RicanPuget Sound SalishRomanianRussianSalvadoranSamoanScandinavianScotch-IrishScottishSeminoleSenegaleseSerbianShoshoneSierra LeoneanSiouxSlavicSlovakSloveneSomaliSouth AfricanSouth AmericanSouth American IndianSoviet UnionSpaniardSpanishSpanish AmericanSpanish American IndianSri LankanSubsaharan AfricanSudaneseSwedishSwissSyrianTaiwaneseThaiTlingit-HaidaTohono O'OdhamTonganTrinidadian and TobagonianTsimshianTurkishU.S. Virgin IslanderUgandanUkrainianUruguayanUteVenezuelanVietnameseWelshWest IndianYakamaYaquiYugoslavianYumanYup'ikZimbabwean
Immigration
NonimmigrantsImmigrantsAfghanistanAfricaAlbaniaArgentinaArmeniaAsiaAustraliaAustriaBahamasBangladeshBarbadosBelarusBelgiumBelizeBoliviaBosnia and HerzegovinaBrazilBulgariaBurma/MyanmarCabo VerdeCambodiaCameroonCanadaCaribbeanCentral AmericaChileChinaColombiaCongoCosta RicaCroatiaCubaCzechoslovakiaDenmarkDominicaDominican RepublicEastern AfricaEastern AsiaEastern EuropeEcuadorEgyptEl SalvadorEnglandEritreaEthiopiaEuropeFijiFranceGermanyGhanaGreeceGrenadaGuatemalaGuyanaHaitiHondurasHong KongHungaryIndiaIndonesiaIranIraqIrelandIsraelItalyJamaicaJapanJordanKazakhstanKenyaKoreaKuwaitLaosLatin AmericaLatviaLebanonLiberiaLithuaniaMalaysiaMexicoMicronesiaMiddle AfricaMoldovaMoroccoNepalNetherlandsNicaraguaNigeriaNorth AmericaNorth MacedoniaNorthern AfricaNorthern EuropeNorwayOceaniaPakistanPanamaPeruPhilippinesPolandPortugalRomaniaRussiaSaudi ArabiaScotlandSenegalSerbiaSierra LeoneSingaporeSomaliaSouth AfricaSouth AmericaSouth Central AsiaSouth Eastern AsiaSouthern EuropeSpainSri LankaSt. Vincent and the GrenadinesSudanSwedenSwitzerlandSyriaTaiwanThailandTrinidad and TobagoTurkeyUgandaUkraineUruguayUzbekistanVenezuelaVietnamWest IndiesWestern AfricaWestern AsiaWestern EuropeYemenZaireZimbabweAzores
Select to Compare
Race
Ancestry
AfghanAfricanAlaska NativeAlaskan AthabascanAlbanianAlsatianAmericanApacheArabArapahoArgentineanArmenianAssyrian/Chaldean/SyriacAustralianAustrianBahamianBangladeshiBarbadianBasqueBelgianBelizeanBermudanBhutaneseBlackfeetBolivianBrazilianBritishBritish West IndianBulgarianBurmeseCajunCambodianCanadianCape VerdeanCarpatho RusynCelticCentral AmericanCentral American IndianCherokeeCheyenneChickasawChileanChineseChippewaChoctawColombianColvilleComancheCosta RicanCreeCreekCroatianCrowCubanCypriotCzechCzechoslovakianDanishDelawareDominicanDutchDutch West IndianEastern EuropeanEcuadorianEgyptianEnglishEstonianEthiopianEuropeanFijianFilipinoFinnishFrenchFrench American IndianFrench CanadianGermanGerman RussianGhanaianGreekGuamanian/ChamorroGuatemalanGuyaneseHaitianHmongHonduranHopiHoumaHungarianIcelanderIndian (Asian)IndonesianInupiatIranianIraqiIrishIroquoisIsraeliItalianJamaicanJapaneseJordanianKenyanKiowaKoreanLaotianLatvianLebaneseLiberianLithuanianLumbeeLuxembourgerMacedonianMalaysianMalteseMarshalleseMenomineeMexicanMexican American IndianMongolianMoroccanNative HawaiianNavajoNepaleseNew ZealanderNicaraguanNigerianNorthern EuropeanNorwegianOkinawanOsageOttawaPaiutePakistaniPalestinianPanamanianParaguayanPennsylvania GermanPeruvianPimaPolishPortuguesePotawatomiPuebloPuerto RicanPuget Sound SalishRomanianRussianSalvadoranSamoanScandinavianScotch-IrishScottishSeminoleSenegaleseSerbianShoshoneSierra LeoneanSiouxSlavicSlovakSloveneSomaliSouth AfricanSouth AmericanSouth American IndianSoviet UnionSpaniardSpanishSpanish AmericanSpanish American IndianSri LankanSubsaharan AfricanSudaneseSwedishSwissSyrianTaiwaneseThaiTlingit-HaidaTohono O'OdhamTonganTrinidadian and TobagonianTsimshianTurkishU.S. Virgin IslanderUgandanUkrainianUruguayanUteVenezuelanVietnameseWelshWest IndianYakamaYaquiYugoslavianYumanYup'ikZimbabwean
Immigration
NonimmigrantsImmigrantsAfghanistanAfricaAlbaniaArgentinaArmeniaAsiaAustraliaAustriaBahamasBangladeshBarbadosBelarusBelgiumBelizeBoliviaBosnia and HerzegovinaBrazilBulgariaBurma/MyanmarCabo VerdeCambodiaCameroonCanadaCaribbeanCentral AmericaChileChinaColombiaCongoCosta RicaCroatiaCubaCzechoslovakiaDenmarkDominicaDominican RepublicEastern AfricaEastern AsiaEastern EuropeEcuadorEgyptEl SalvadorEnglandEritreaEthiopiaEuropeFijiFranceGermanyGhanaGreeceGrenadaGuatemalaGuyanaHaitiHondurasHong KongHungaryIndiaIndonesiaIranIraqIrelandIsraelItalyJamaicaJapanJordanKazakhstanKenyaKoreaKuwaitLaosLatin AmericaLatviaLebanonLiberiaLithuaniaMalaysiaMexicoMicronesiaMiddle AfricaMoldovaMoroccoNepalNetherlandsNicaraguaNigeriaNorth AmericaNorth MacedoniaNorthern AfricaNorthern EuropeNorwayOceaniaPakistanPanamaPeruPhilippinesPolandPortugalRomaniaRussiaSaudi ArabiaScotlandSenegalSerbiaSierra LeoneSingaporeSomaliaSouth AfricaSouth AmericaSouth Central AsiaSouth Eastern AsiaSouthern EuropeSpainSri LankaSt. Vincent and the GrenadinesSudanSwedenSwitzerlandSyriaTaiwanThailandTrinidad and TobagoTurkeyUgandaUkraineUruguayUzbekistanVenezuelaVietnamWest IndiesWestern AfricaWestern AsiaWestern EuropeYemenZaireZimbabweAzores
Married-Couple Family Poverty
Income
Poverty
Unemployment
Labor Participation
Family Structure
Vehicle Availability
Education Level
Disability

Aleut Married-Couple Family Poverty
Exceptional

4.7%
POVERTY | MARRIED-COUPLE FAMILIES
97.0/ 100
METRIC RATING
105th/ 347
METRIC RANK

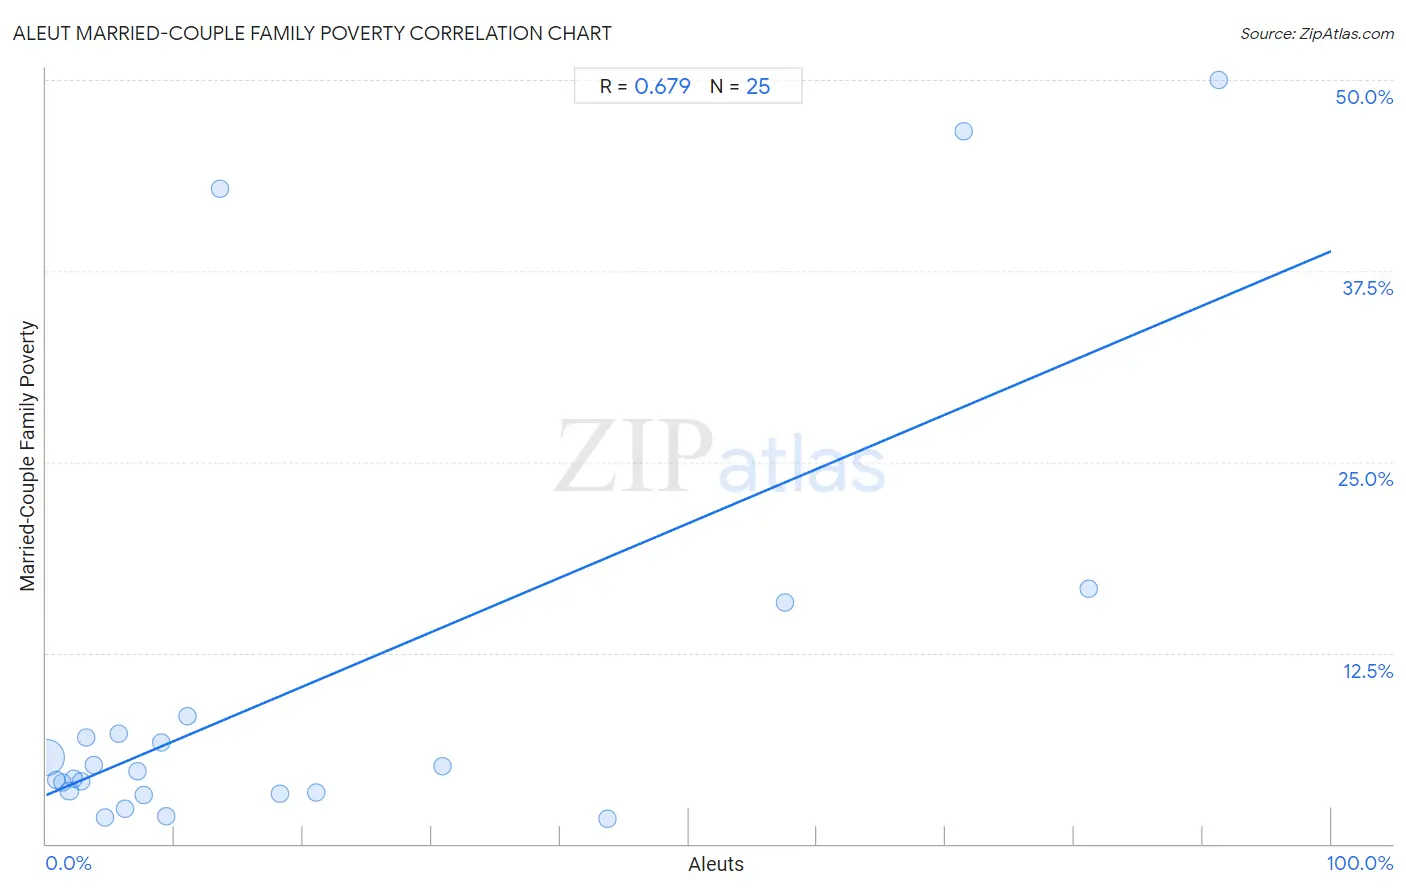
Aleut Married-Couple Family Poverty Correlation Chart

The statistical analysis conducted on geographies consisting of 61,581,889 people shows a significant positive correlation between the proportion of Aleuts and poverty level among married-couple families in the United States with a correlation coefficient (R) of 0.679 and weighted average of 4.7%. On average, for every 1% (one percent) increase in Aleuts within a typical geography, there is an increase of 0.36% in poverty level among married-couple families.
Aleut Married-Couple Family Poverty
It is essential to understand that the correlation between the percentage of Aleuts and poverty level among married-couple families does not imply a direct cause-and-effect relationship. It remains uncertain whether the presence of Aleuts influences an upward or downward trend in the level of poverty level among married-couple families within an area, or if Aleuts simply ended up residing in those areas with higher or lower levels of poverty level among married-couple families due to other factors.

Demographics Similar to Aleuts by Married-Couple Family Poverty

In terms of married-couple family poverty, the demographic groups most similar to Aleuts are Immigrants from Moldova (4.7%, a difference of 0.070%), Immigrants from France (4.7%, a difference of 0.15%), Immigrants from Germany (4.7%, a difference of 0.16%), Immigrants from Romania (4.7%, a difference of 0.41%), and Laotian (4.7%, a difference of 0.43%).
DemographicsRating | RankMarried-Couple Family Poverty
Native Hawaiians
98.0
/100
|
#98
Exceptional
4.6%
Immigrants from Europe
97.9
/100
|
#99
Exceptional
4.6%
Immigrants from Western Europe
97.9
/100
|
#100
Exceptional
4.6%
Yugoslavians
97.8
/100
|
#101
Exceptional
4.6%
Asians
97.6
/100
|
#102
Exceptional
4.7%
Immigrants from Romania
97.3
/100
|
#103
Exceptional
4.7%
Immigrants from Moldova
97.1
/100
|
#104
Exceptional
4.7%
Aleuts
97.0
/100
|
#105
Exceptional
4.7%
Immigrants from France
96.9
/100
|
#106
Exceptional
4.7%
Immigrants from Germany
96.8
/100
|
#107
Exceptional
4.7%
Laotians
96.6
/100
|
#108
Exceptional
4.7%
Immigrants from Hong Kong
96.4
/100
|
#109
Exceptional
4.7%
Immigrants from Bolivia
96.2
/100
|
#110
Exceptional
4.7%
Pakistanis
96.2
/100
|
#111
Exceptional
4.7%
Tongans
95.9
/100
|
#112
Exceptional
4.7%

Aleut Married-Couple Family Poverty Correlation Summary

MeasurementAleut DataMarried-Couple Family Poverty Data
Minimum0.022%1.6%
Maximum91.2%50.0%
Range91.2%48.4%
Mean20.2%10.4%
Median7.6%4.8%
Interquartile 25% (IQ1)2.9%3.3%
Interquartile 75% (IQ3)25.9%7.8%
Interquartile Range (IQR)23.0%4.5%
Standard Deviation (Sample)27.0%14.1%
Standard Deviation (Population)26.4%13.9%

Correlation Details

Aleut PercentileSample SizeMarried-Couple Family Poverty
[
0.0%
-
0.5%
]
0.022%
60,388,3035.7%
[
0.5%
-
1.0%
]
0.74%
338,9664.2%
[
1.0%
-
1.5%
]
1.22%
187,1004.0%
[
1.5%
-
2.0%
]
1.80%
471,5823.4%
[
2.0%
-
2.5%
]
2.13%
85,3854.3%
[
2.5%
-
3.0%
]
2.69%
37,4864.1%
[
3.0%
-
3.5%
]
3.16%
8,0747.0%
[
3.5%
-
4.0%
]
3.66%
14,8265.2%
[
4.5%
-
5.0%
]
4.59%
12,6201.7%
[
5.5%
-
6.0%
]
5.66%
2,8797.2%
[
6.0%
-
6.5%
]
6.17%
3,5802.3%
[
7.0%
-
7.5%
]
7.14%
1824.8%
[
7.5%
-
8.0%
]
7.61%
10,3513.2%
[
8.5%
-
9.0%
]
8.98%
4016.7%
[
9.0%
-
9.5%
]
9.38%
12,6181.8%
[
11.0%
-
11.5%
]
11.00%
2098.3%
[
13.5%
-
14.0%
]
13.51%
3742.9%
[
18.0%
-
18.5%
]
18.19%
3,6173.3%
[
21.0%
-
21.5%
]
21.05%
8363.4%
[
30.5%
-
31.0%
]
30.80%
2375.1%
[
43.5%
-
44.0%
]
43.70%
2,0961.6%
[
57.0%
-
57.5%
]
57.45%
9415.8%
[
71.0%
-
71.5%
]
71.43%
12646.7%
[
81.0%
-
81.5%
]
81.18%
17016.7%
[
91.0%
-
91.5%
]
91.23%
11450.0%