Immigrants from Somalia Married-Couple Family Poverty
COMPARE
Immigrants from Somalia
Select to Compare
Married-Couple Family Poverty
Immigrants from Somalia Married-Couple Family Poverty
6.0%
POVERTY | MARRIED-COUPLE FAMILIES
0.7/ 100
METRIC RATING
254th/ 347
METRIC RANK
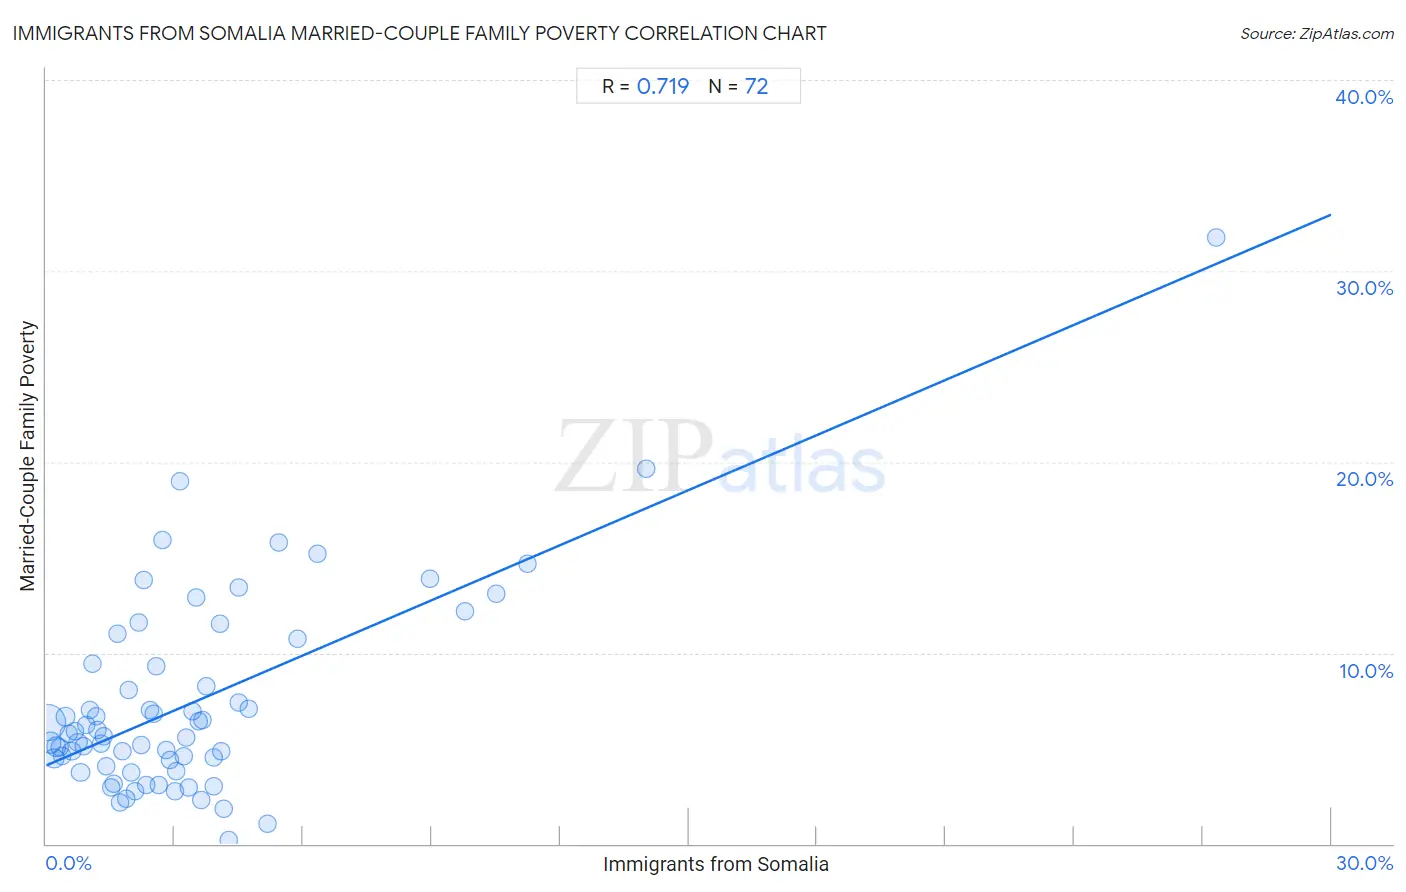
Immigrants from Somalia Married-Couple Family Poverty Correlation Chart
The statistical analysis conducted on geographies consisting of 91,930,592 people shows a strong positive correlation between the proportion of Immigrants from Somalia and poverty level among married-couple families in the United States with a correlation coefficient (R) of 0.719 and weighted average of 6.0%. On average, for every 1% (one percent) increase in Immigrants from Somalia within a typical geography, there is an increase of 0.96% in poverty level among married-couple families.
It is essential to understand that the correlation between the percentage of Immigrants from Somalia and poverty level among married-couple families does not imply a direct cause-and-effect relationship. It remains uncertain whether the presence of Immigrants from Somalia influences an upward or downward trend in the level of poverty level among married-couple families within an area, or if Immigrants from Somalia simply ended up residing in those areas with higher or lower levels of poverty level among married-couple families due to other factors.
Demographics Similar to Immigrants from Somalia by Married-Couple Family Poverty
In terms of married-couple family poverty, the demographic groups most similar to Immigrants from Somalia are African (6.0%, a difference of 0.060%), Immigrants from Western Asia (6.0%, a difference of 0.15%), Comanche (6.0%, a difference of 0.15%), Bangladeshi (6.0%, a difference of 0.65%), and Immigrants from Ghana (5.9%, a difference of 0.79%).
| Demographics | Rating | Rank | Married-Couple Family Poverty |
| Iraqis | 1.4 /100 | #247 | Tragic 5.9% |
| Cree | 1.2 /100 | #248 | Tragic 5.9% |
| Tsimshian | 1.1 /100 | #249 | Tragic 5.9% |
| Immigrants from Eritrea | 1.1 /100 | #250 | Tragic 5.9% |
| Immigrants from Ghana | 1.0 /100 | #251 | Tragic 5.9% |
| Immigrants from Western Asia | 0.7 /100 | #252 | Tragic 6.0% |
| Africans | 0.7 /100 | #253 | Tragic 6.0% |
| Immigrants from Somalia | 0.7 /100 | #254 | Tragic 6.0% |
| Comanche | 0.7 /100 | #255 | Tragic 6.0% |
| Bangladeshis | 0.5 /100 | #256 | Tragic 6.0% |
| Immigrants from Burma/Myanmar | 0.5 /100 | #257 | Tragic 6.0% |
| Immigrants | 0.5 /100 | #258 | Tragic 6.0% |
| Alaskan Athabascans | 0.4 /100 | #259 | Tragic 6.1% |
| Jamaicans | 0.3 /100 | #260 | Tragic 6.1% |
| Senegalese | 0.3 /100 | #261 | Tragic 6.1% |
Immigrants from Somalia Married-Couple Family Poverty Correlation Summary
| Measurement | Immigrants from Somalia Data | Married-Couple Family Poverty Data |
| Minimum | 0.018% | 0.17% |
| Maximum | 27.3% | 31.7% |
| Range | 27.3% | 31.6% |
| Mean | 3.4% | 7.3% |
| Median | 2.5% | 5.7% |
| Interquartile 25% (IQ1) | 1.2% | 4.3% |
| Interquartile 75% (IQ3) | 3.9% | 9.4% |
| Interquartile Range (IQR) | 2.7% | 5.1% |
| Standard Deviation (Sample) | 3.9% | 5.2% |
| Standard Deviation (Population) | 3.9% | 5.2% |
Correlation Details
| Immigrants from Somalia Percentile | Sample Size | Married-Couple Family Poverty |
[ 0.0% - 0.5% ] 0.018% | 57,907,996 | 6.4% |
[ 0.0% - 0.5% ] 0.10% | 10,715,320 | 5.3% |
[ 0.0% - 0.5% ] 0.18% | 5,850,707 | 4.5% |
[ 0.0% - 0.5% ] 0.24% | 4,520,382 | 5.1% |
[ 0.0% - 0.5% ] 0.31% | 1,481,180 | 5.0% |
[ 0.0% - 0.5% ] 0.37% | 1,984,969 | 4.6% |
[ 0.0% - 0.5% ] 0.45% | 832,727 | 6.7% |
[ 0.5% - 1.0% ] 0.52% | 606,304 | 5.8% |
[ 0.5% - 1.0% ] 0.60% | 627,109 | 4.9% |
[ 0.5% - 1.0% ] 0.67% | 488,687 | 5.9% |
[ 0.5% - 1.0% ] 0.74% | 639,440 | 5.3% |
[ 0.5% - 1.0% ] 0.80% | 468,742 | 3.7% |
[ 0.5% - 1.0% ] 0.87% | 536,170 | 5.1% |
[ 0.5% - 1.0% ] 0.94% | 233,534 | 6.2% |
[ 1.0% - 1.5% ] 1.03% | 209,423 | 7.0% |
[ 1.0% - 1.5% ] 1.07% | 140,406 | 9.4% |
[ 1.0% - 1.5% ] 1.16% | 119,914 | 6.7% |
[ 1.0% - 1.5% ] 1.21% | 458,328 | 6.0% |
[ 1.0% - 1.5% ] 1.28% | 965,145 | 5.2% |
[ 1.0% - 1.5% ] 1.35% | 51,488 | 5.6% |
[ 1.0% - 1.5% ] 1.41% | 238,741 | 4.1% |
[ 1.5% - 2.0% ] 1.50% | 203,501 | 2.9% |
[ 1.5% - 2.0% ] 1.57% | 242,134 | 3.1% |
[ 1.5% - 2.0% ] 1.65% | 37,120 | 11.0% |
[ 1.5% - 2.0% ] 1.72% | 128,441 | 2.1% |
[ 1.5% - 2.0% ] 1.78% | 206,558 | 4.8% |
[ 1.5% - 2.0% ] 1.86% | 81,772 | 2.4% |
[ 1.5% - 2.0% ] 1.94% | 78,564 | 8.1% |
[ 1.5% - 2.0% ] 1.99% | 95,882 | 3.7% |
[ 2.0% - 2.5% ] 2.06% | 170,632 | 2.8% |
[ 2.0% - 2.5% ] 2.16% | 55,168 | 11.6% |
[ 2.0% - 2.5% ] 2.21% | 25,299 | 5.1% |
[ 2.0% - 2.5% ] 2.27% | 29,001 | 13.8% |
[ 2.0% - 2.5% ] 2.32% | 24,790 | 3.1% |
[ 2.0% - 2.5% ] 2.41% | 85,038 | 7.0% |
[ 2.5% - 3.0% ] 2.51% | 40,813 | 6.8% |
[ 2.5% - 3.0% ] 2.56% | 7,066 | 9.3% |
[ 2.5% - 3.0% ] 2.64% | 45,105 | 3.1% |
[ 2.5% - 3.0% ] 2.72% | 2,245 | 15.9% |
[ 2.5% - 3.0% ] 2.79% | 24,685 | 4.9% |
[ 2.5% - 3.0% ] 2.89% | 8,923 | 4.4% |
[ 2.5% - 3.0% ] 3.00% | 36,473 | 2.8% |
[ 3.0% - 3.5% ] 3.04% | 439,052 | 3.8% |
[ 3.0% - 3.5% ] 3.12% | 14,212 | 19.0% |
[ 3.0% - 3.5% ] 3.22% | 21,569 | 4.6% |
[ 3.0% - 3.5% ] 3.28% | 21,006 | 5.6% |
[ 3.0% - 3.5% ] 3.34% | 32,266 | 3.0% |
[ 3.0% - 3.5% ] 3.40% | 23,785 | 6.9% |
[ 3.0% - 3.5% ] 3.49% | 10,662 | 12.9% |
[ 3.5% - 4.0% ] 3.56% | 68,910 | 6.4% |
[ 3.5% - 4.0% ] 3.62% | 49,196 | 2.3% |
[ 3.5% - 4.0% ] 3.65% | 48,985 | 6.5% |
[ 3.5% - 4.0% ] 3.75% | 100,849 | 8.3% |
[ 3.5% - 4.0% ] 3.91% | 30,927 | 4.5% |
[ 3.5% - 4.0% ] 3.92% | 30,938 | 3.0% |
[ 4.0% - 4.5% ] 4.06% | 43,391 | 11.5% |
[ 4.0% - 4.5% ] 4.08% | 81,929 | 4.8% |
[ 4.0% - 4.5% ] 4.13% | 27,523 | 1.8% |
[ 4.0% - 4.5% ] 4.25% | 6,968 | 0.17% |
[ 4.0% - 4.5% ] 4.48% | 2,589 | 7.4% |
[ 4.0% - 4.5% ] 4.48% | 4,842 | 13.4% |
[ 4.5% - 5.0% ] 4.73% | 39,177 | 7.1% |
[ 5.0% - 5.5% ] 5.16% | 5,984 | 1.1% |
[ 5.0% - 5.5% ] 5.44% | 32,136 | 15.8% |
[ 5.5% - 6.0% ] 5.87% | 1,005 | 10.7% |
[ 6.0% - 6.5% ] 6.33% | 30,625 | 15.2% |
[ 8.5% - 9.0% ] 8.96% | 28,172 | 13.9% |
[ 9.5% - 10.0% ] 9.77% | 8,290 | 12.2% |
[ 10.5% - 11.0% ] 10.52% | 7,703 | 13.1% |
[ 11.0% - 11.5% ] 11.24% | 1,930 | 14.7% |
[ 14.0% - 14.5% ] 14.00% | 1,157 | 19.6% |
[ 27.0% - 27.5% ] 27.31% | 8,892 | 31.7% |