Seminole Married-Couple Family Poverty

COMPARE

Seminole
Race
Ancestry
AfghanAfricanAlaska NativeAlaskan AthabascanAlbanianAleutAlsatianAmericanApacheArabArapahoArgentineanArmenianAssyrian/Chaldean/SyriacAustralianAustrianBahamianBangladeshiBarbadianBasqueBelgianBelizeanBermudanBhutaneseBlackfeetBolivianBrazilianBritishBritish West IndianBulgarianBurmeseCajunCambodianCanadianCape VerdeanCarpatho RusynCelticCentral AmericanCentral American IndianCherokeeCheyenneChickasawChileanChineseChippewaChoctawColombianColvilleComancheCosta RicanCreeCreekCroatianCrowCubanCypriotCzechCzechoslovakianDanishDelawareDominicanDutchDutch West IndianEastern EuropeanEcuadorianEgyptianEnglishEstonianEthiopianEuropeanFijianFilipinoFinnishFrenchFrench American IndianFrench CanadianGermanGerman RussianGhanaianGreekGuamanian/ChamorroGuatemalanGuyaneseHaitianHmongHonduranHopiHoumaHungarianIcelanderIndian (Asian)IndonesianInupiatIranianIraqiIrishIroquoisIsraeliItalianJamaicanJapaneseJordanianKenyanKiowaKoreanLaotianLatvianLebaneseLiberianLithuanianLumbeeLuxembourgerMacedonianMalaysianMalteseMarshalleseMenomineeMexicanMexican American IndianMongolianMoroccanNative HawaiianNavajoNepaleseNew ZealanderNicaraguanNigerianNorthern EuropeanNorwegianOkinawanOsageOttawaPaiutePakistaniPalestinianPanamanianParaguayanPennsylvania GermanPeruvianPimaPolishPortuguesePotawatomiPuebloPuerto RicanPuget Sound SalishRomanianRussianSalvadoranSamoanScandinavianScotch-IrishScottishSeminoleSenegaleseSerbianShoshoneSierra LeoneanSiouxSlavicSlovakSloveneSomaliSouth AfricanSouth AmericanSouth American IndianSoviet UnionSpaniardSpanishSpanish AmericanSpanish American IndianSri LankanSubsaharan AfricanSudaneseSwedishSwissSyrianTaiwaneseThaiTlingit-HaidaTohono O'OdhamTonganTrinidadian and TobagonianTsimshianTurkishU.S. Virgin IslanderUgandanUkrainianUruguayanUteVenezuelanVietnameseWelshWest IndianYakamaYaquiYugoslavianYumanYup'ikZimbabwean
Immigration
NonimmigrantsImmigrantsAfghanistanAfricaAlbaniaArgentinaArmeniaAsiaAustraliaAustriaBahamasBangladeshBarbadosBelarusBelgiumBelizeBoliviaBosnia and HerzegovinaBrazilBulgariaBurma/MyanmarCabo VerdeCambodiaCameroonCanadaCaribbeanCentral AmericaChileChinaColombiaCongoCosta RicaCroatiaCubaCzechoslovakiaDenmarkDominicaDominican RepublicEastern AfricaEastern AsiaEastern EuropeEcuadorEgyptEl SalvadorEnglandEritreaEthiopiaEuropeFijiFranceGermanyGhanaGreeceGrenadaGuatemalaGuyanaHaitiHondurasHong KongHungaryIndiaIndonesiaIranIraqIrelandIsraelItalyJamaicaJapanJordanKazakhstanKenyaKoreaKuwaitLaosLatin AmericaLatviaLebanonLiberiaLithuaniaMalaysiaMexicoMicronesiaMiddle AfricaMoldovaMoroccoNepalNetherlandsNicaraguaNigeriaNorth AmericaNorth MacedoniaNorthern AfricaNorthern EuropeNorwayOceaniaPakistanPanamaPeruPhilippinesPolandPortugalRomaniaRussiaSaudi ArabiaScotlandSenegalSerbiaSierra LeoneSingaporeSomaliaSouth AfricaSouth AmericaSouth Central AsiaSouth Eastern AsiaSouthern EuropeSpainSri LankaSt. Vincent and the GrenadinesSudanSwedenSwitzerlandSyriaTaiwanThailandTrinidad and TobagoTurkeyUgandaUkraineUruguayUzbekistanVenezuelaVietnamWest IndiesWestern AfricaWestern AsiaWestern EuropeYemenZaireZimbabweAzores
Select to Compare
Race
Ancestry
AfghanAfricanAlaska NativeAlaskan AthabascanAlbanianAleutAlsatianAmericanApacheArabArapahoArgentineanArmenianAssyrian/Chaldean/SyriacAustralianAustrianBahamianBangladeshiBarbadianBasqueBelgianBelizeanBermudanBhutaneseBlackfeetBolivianBrazilianBritishBritish West IndianBulgarianBurmeseCajunCambodianCanadianCape VerdeanCarpatho RusynCelticCentral AmericanCentral American IndianCherokeeCheyenneChickasawChileanChineseChippewaChoctawColombianColvilleComancheCosta RicanCreeCreekCroatianCrowCubanCypriotCzechCzechoslovakianDanishDelawareDominicanDutchDutch West IndianEastern EuropeanEcuadorianEgyptianEnglishEstonianEthiopianEuropeanFijianFilipinoFinnishFrenchFrench American IndianFrench CanadianGermanGerman RussianGhanaianGreekGuamanian/ChamorroGuatemalanGuyaneseHaitianHmongHonduranHopiHoumaHungarianIcelanderIndian (Asian)IndonesianInupiatIranianIraqiIrishIroquoisIsraeliItalianJamaicanJapaneseJordanianKenyanKiowaKoreanLaotianLatvianLebaneseLiberianLithuanianLumbeeLuxembourgerMacedonianMalaysianMalteseMarshalleseMenomineeMexicanMexican American IndianMongolianMoroccanNative HawaiianNavajoNepaleseNew ZealanderNicaraguanNigerianNorthern EuropeanNorwegianOkinawanOsageOttawaPaiutePakistaniPalestinianPanamanianParaguayanPennsylvania GermanPeruvianPimaPolishPortuguesePotawatomiPuebloPuerto RicanPuget Sound SalishRomanianRussianSalvadoranSamoanScandinavianScotch-IrishScottishSenegaleseSerbianShoshoneSierra LeoneanSiouxSlavicSlovakSloveneSomaliSouth AfricanSouth AmericanSouth American IndianSoviet UnionSpaniardSpanishSpanish AmericanSpanish American IndianSri LankanSubsaharan AfricanSudaneseSwedishSwissSyrianTaiwaneseThaiTlingit-HaidaTohono O'OdhamTonganTrinidadian and TobagonianTsimshianTurkishU.S. Virgin IslanderUgandanUkrainianUruguayanUteVenezuelanVietnameseWelshWest IndianYakamaYaquiYugoslavianYumanYup'ikZimbabwean
Immigration
NonimmigrantsImmigrantsAfghanistanAfricaAlbaniaArgentinaArmeniaAsiaAustraliaAustriaBahamasBangladeshBarbadosBelarusBelgiumBelizeBoliviaBosnia and HerzegovinaBrazilBulgariaBurma/MyanmarCabo VerdeCambodiaCameroonCanadaCaribbeanCentral AmericaChileChinaColombiaCongoCosta RicaCroatiaCubaCzechoslovakiaDenmarkDominicaDominican RepublicEastern AfricaEastern AsiaEastern EuropeEcuadorEgyptEl SalvadorEnglandEritreaEthiopiaEuropeFijiFranceGermanyGhanaGreeceGrenadaGuatemalaGuyanaHaitiHondurasHong KongHungaryIndiaIndonesiaIranIraqIrelandIsraelItalyJamaicaJapanJordanKazakhstanKenyaKoreaKuwaitLaosLatin AmericaLatviaLebanonLiberiaLithuaniaMalaysiaMexicoMicronesiaMiddle AfricaMoldovaMoroccoNepalNetherlandsNicaraguaNigeriaNorth AmericaNorth MacedoniaNorthern AfricaNorthern EuropeNorwayOceaniaPakistanPanamaPeruPhilippinesPolandPortugalRomaniaRussiaSaudi ArabiaScotlandSenegalSerbiaSierra LeoneSingaporeSomaliaSouth AfricaSouth AmericaSouth Central AsiaSouth Eastern AsiaSouthern EuropeSpainSri LankaSt. Vincent and the GrenadinesSudanSwedenSwitzerlandSyriaTaiwanThailandTrinidad and TobagoTurkeyUgandaUkraineUruguayUzbekistanVenezuelaVietnamWest IndiesWestern AfricaWestern AsiaWestern EuropeYemenZaireZimbabweAzores
Married-Couple Family Poverty
Income
Poverty
Unemployment
Labor Participation
Family Structure
Vehicle Availability
Education Level
Disability

Seminole Married-Couple Family Poverty
Tragic

6.4%
POVERTY | MARRIED-COUPLE FAMILIES
0.0/ 100
METRIC RATING
282nd/ 347
METRIC RANK

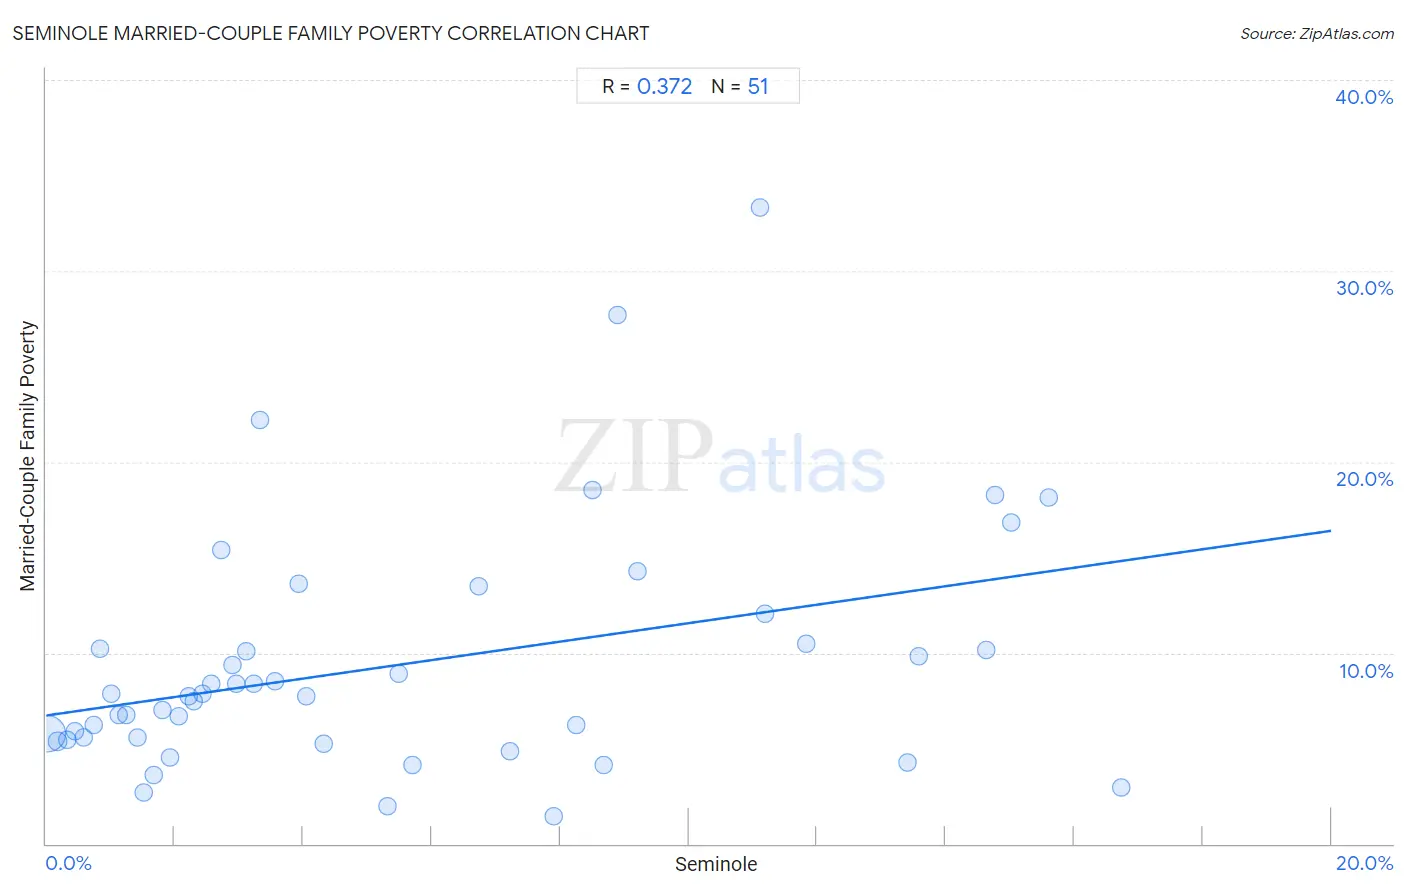
Seminole Married-Couple Family Poverty Correlation Chart

The statistical analysis conducted on geographies consisting of 118,024,519 people shows a mild positive correlation between the proportion of Seminole and poverty level among married-couple families in the United States with a correlation coefficient (R) of 0.372 and weighted average of 6.4%. On average, for every 1% (one percent) increase in Seminole within a typical geography, there is an increase of 0.48% in poverty level among married-couple families.
Seminole Married-Couple Family Poverty
It is essential to understand that the correlation between the percentage of Seminole and poverty level among married-couple families does not imply a direct cause-and-effect relationship. It remains uncertain whether the presence of Seminole influences an upward or downward trend in the level of poverty level among married-couple families within an area, or if Seminole simply ended up residing in those areas with higher or lower levels of poverty level among married-couple families due to other factors.

Demographics Similar to Seminole by Married-Couple Family Poverty

In terms of married-couple family poverty, the demographic groups most similar to Seminole are Mexican American Indian (6.4%, a difference of 0.0%), Ute (6.4%, a difference of 0.38%), Dutch West Indian (6.4%, a difference of 0.50%), West Indian (6.4%, a difference of 0.51%), and Houma (6.4%, a difference of 0.56%).
DemographicsRating | RankMarried-Couple Family Poverty
Choctaw
0.1
/100
|
#275
Tragic
6.3%
Yaqui
0.1
/100
|
#276
Tragic
6.3%
Indonesians
0.1
/100
|
#277
Tragic
6.3%
Immigrants from Trinidad and Tobago
0.1
/100
|
#278
Tragic
6.4%
Houma
0.0
/100
|
#279
Tragic
6.4%
West Indians
0.0
/100
|
#280
Tragic
6.4%
Mexican American Indians
0.0
/100
|
#281
Tragic
6.4%
Seminole
0.0
/100
|
#282
Tragic
6.4%
Ute
0.0
/100
|
#283
Tragic
6.4%
Dutch West Indians
0.0
/100
|
#284
Tragic
6.4%
Blacks/African Americans
0.0
/100
|
#285
Tragic
6.5%
Guyanese
0.0
/100
|
#286
Tragic
6.5%
Ecuadorians
0.0
/100
|
#287
Tragic
6.5%
Salvadorans
0.0
/100
|
#288
Tragic
6.5%
Nepalese
0.0
/100
|
#289
Tragic
6.5%

Seminole Married-Couple Family Poverty Correlation Summary

MeasurementSeminole DataMarried-Couple Family Poverty Data
Minimum0.021%1.5%
Maximum16.7%33.3%
Range16.7%31.9%
Mean5.5%9.4%
Median3.3%7.7%
Interquartile 25% (IQ1)1.7%5.4%
Interquartile 75% (IQ3)8.7%10.4%
Interquartile Range (IQR)7.0%5.0%
Standard Deviation (Sample)4.9%6.3%
Standard Deviation (Population)4.8%6.3%

Correlation Details

Seminole PercentileSample SizeMarried-Couple Family Poverty
[
0.0%
-
0.5%
]
0.021%
107,128,6135.7%
[
0.0%
-
0.5%
]
0.18%
6,384,9395.4%
[
0.0%
-
0.5%
]
0.33%
2,202,9115.4%
[
0.0%
-
0.5%
]
0.45%
883,4265.9%
[
0.5%
-
1.0%
]
0.59%
452,0995.6%
[
0.5%
-
1.0%
]
0.73%
186,9156.3%
[
0.5%
-
1.0%
]
0.84%
132,68510.2%
[
1.0%
-
1.5%
]
1.01%
104,6427.9%
[
1.0%
-
1.5%
]
1.13%
177,0906.8%
[
1.0%
-
1.5%
]
1.25%
62,1726.7%
[
1.0%
-
1.5%
]
1.42%
29,4345.6%
[
1.5%
-
2.0%
]
1.52%
13,8312.7%
[
1.5%
-
2.0%
]
1.67%
24,8123.6%
[
1.5%
-
2.0%
]
1.81%
61,5857.0%
[
1.5%
-
2.0%
]
1.92%
7,5614.5%
[
2.0%
-
2.5%
]
2.07%
41,1946.7%
[
2.0%
-
2.5%
]
2.22%
20,6417.7%
[
2.0%
-
2.5%
]
2.30%
22,4327.5%
[
2.0%
-
2.5%
]
2.43%
2,4727.8%
[
2.5%
-
3.0%
]
2.58%
1,3598.4%
[
2.5%
-
3.0%
]
2.72%
2,83115.4%
[
2.5%
-
3.0%
]
2.90%
9,3509.4%
[
2.5%
-
3.0%
]
2.96%
6,9208.4%
[
3.0%
-
3.5%
]
3.11%
9,97610.1%
[
3.0%
-
3.5%
]
3.23%
4,1788.4%
[
3.0%
-
3.5%
]
3.33%
6022.2%
[
3.5%
-
4.0%
]
3.56%
3,9648.5%
[
3.5%
-
4.0%
]
3.93%
28013.6%
[
4.0%
-
4.5%
]
4.05%
2,4227.7%
[
4.0%
-
4.5%
]
4.31%
1165.3%
[
5.0%
-
5.5%
]
5.32%
1,1102.0%
[
5.0%
-
5.5%
]
5.48%
2928.9%
[
5.5%
-
6.0%
]
5.71%
4034.1%
[
6.5%
-
7.0%
]
6.72%
1,08613.5%
[
7.0%
-
7.5%
]
7.23%
1,1904.9%
[
7.5%
-
8.0%
]
7.89%
1,1661.5%
[
8.0%
-
8.5%
]
8.25%
1,8056.2%
[
8.5%
-
9.0%
]
8.51%
18818.5%
[
8.5%
-
9.0%
]
8.67%
2,0194.1%
[
8.5%
-
9.0%
]
8.89%
40527.7%
[
9.0%
-
9.5%
]
9.20%
17414.3%
[
11.0%
-
11.5%
]
11.11%
5433.3%
[
11.0%
-
11.5%
]
11.19%
12,32912.0%
[
11.5%
-
12.0%
]
11.83%
37210.4%
[
13.0%
-
13.5%
]
13.40%
2,8874.2%
[
13.5%
-
14.0%
]
13.57%
5,5789.8%
[
14.5%
-
15.0%
]
14.63%
1,16910.1%
[
14.5%
-
15.0%
]
14.77%
7,14418.3%
[
15.0%
-
15.5%
]
15.01%
3,12416.9%
[
15.5%
-
16.0%
]
15.60%
56418.1%
[
16.5%
-
17.0%
]
16.73%
5502.9%