Immigrants from Poland Married-Couple Family Poverty

COMPARE

Immigrants from Poland
Race
Ancestry
AfghanAfricanAlaska NativeAlaskan AthabascanAlbanianAleutAlsatianAmericanApacheArabArapahoArgentineanArmenianAssyrian/Chaldean/SyriacAustralianAustrianBahamianBangladeshiBarbadianBasqueBelgianBelizeanBermudanBhutaneseBlackfeetBolivianBrazilianBritishBritish West IndianBulgarianBurmeseCajunCambodianCanadianCape VerdeanCarpatho RusynCelticCentral AmericanCentral American IndianCherokeeCheyenneChickasawChileanChineseChippewaChoctawColombianColvilleComancheCosta RicanCreeCreekCroatianCrowCubanCypriotCzechCzechoslovakianDanishDelawareDominicanDutchDutch West IndianEastern EuropeanEcuadorianEgyptianEnglishEstonianEthiopianEuropeanFijianFilipinoFinnishFrenchFrench American IndianFrench CanadianGermanGerman RussianGhanaianGreekGuamanian/ChamorroGuatemalanGuyaneseHaitianHmongHonduranHopiHoumaHungarianIcelanderIndian (Asian)IndonesianInupiatIranianIraqiIrishIroquoisIsraeliItalianJamaicanJapaneseJordanianKenyanKiowaKoreanLaotianLatvianLebaneseLiberianLithuanianLumbeeLuxembourgerMacedonianMalaysianMalteseMarshalleseMenomineeMexicanMexican American IndianMongolianMoroccanNative HawaiianNavajoNepaleseNew ZealanderNicaraguanNigerianNorthern EuropeanNorwegianOkinawanOsageOttawaPaiutePakistaniPalestinianPanamanianParaguayanPennsylvania GermanPeruvianPimaPolishPortuguesePotawatomiPuebloPuerto RicanPuget Sound SalishRomanianRussianSalvadoranSamoanScandinavianScotch-IrishScottishSeminoleSenegaleseSerbianShoshoneSierra LeoneanSiouxSlavicSlovakSloveneSomaliSouth AfricanSouth AmericanSouth American IndianSoviet UnionSpaniardSpanishSpanish AmericanSpanish American IndianSri LankanSubsaharan AfricanSudaneseSwedishSwissSyrianTaiwaneseThaiTlingit-HaidaTohono O'OdhamTonganTrinidadian and TobagonianTsimshianTurkishU.S. Virgin IslanderUgandanUkrainianUruguayanUteVenezuelanVietnameseWelshWest IndianYakamaYaquiYugoslavianYumanYup'ikZimbabwean
Immigration
NonimmigrantsImmigrantsAfghanistanAfricaAlbaniaArgentinaArmeniaAsiaAustraliaAustriaBahamasBangladeshBarbadosBelarusBelgiumBelizeBoliviaBosnia and HerzegovinaBrazilBulgariaBurma/MyanmarCabo VerdeCambodiaCameroonCanadaCaribbeanCentral AmericaChileChinaColombiaCongoCosta RicaCroatiaCubaCzechoslovakiaDenmarkDominicaDominican RepublicEastern AfricaEastern AsiaEastern EuropeEcuadorEgyptEl SalvadorEnglandEritreaEthiopiaEuropeFijiFranceGermanyGhanaGreeceGrenadaGuatemalaGuyanaHaitiHondurasHong KongHungaryIndiaIndonesiaIranIraqIrelandIsraelItalyJamaicaJapanJordanKazakhstanKenyaKoreaKuwaitLaosLatin AmericaLatviaLebanonLiberiaLithuaniaMalaysiaMexicoMicronesiaMiddle AfricaMoldovaMoroccoNepalNetherlandsNicaraguaNigeriaNorth AmericaNorth MacedoniaNorthern AfricaNorthern EuropeNorwayOceaniaPakistanPanamaPeruPhilippinesPolandPortugalRomaniaRussiaSaudi ArabiaScotlandSenegalSerbiaSierra LeoneSingaporeSomaliaSouth AfricaSouth AmericaSouth Central AsiaSouth Eastern AsiaSouthern EuropeSpainSri LankaSt. Vincent and the GrenadinesSudanSwedenSwitzerlandSyriaTaiwanThailandTrinidad and TobagoTurkeyUgandaUkraineUruguayUzbekistanVenezuelaVietnamWest IndiesWestern AfricaWestern AsiaWestern EuropeYemenZaireZimbabweAzores
Select to Compare
Race
Ancestry
AfghanAfricanAlaska NativeAlaskan AthabascanAlbanianAleutAlsatianAmericanApacheArabArapahoArgentineanArmenianAssyrian/Chaldean/SyriacAustralianAustrianBahamianBangladeshiBarbadianBasqueBelgianBelizeanBermudanBhutaneseBlackfeetBolivianBrazilianBritishBritish West IndianBulgarianBurmeseCajunCambodianCanadianCape VerdeanCarpatho RusynCelticCentral AmericanCentral American IndianCherokeeCheyenneChickasawChileanChineseChippewaChoctawColombianColvilleComancheCosta RicanCreeCreekCroatianCrowCubanCypriotCzechCzechoslovakianDanishDelawareDominicanDutchDutch West IndianEastern EuropeanEcuadorianEgyptianEnglishEstonianEthiopianEuropeanFijianFilipinoFinnishFrenchFrench American IndianFrench CanadianGermanGerman RussianGhanaianGreekGuamanian/ChamorroGuatemalanGuyaneseHaitianHmongHonduranHopiHoumaHungarianIcelanderIndian (Asian)IndonesianInupiatIranianIraqiIrishIroquoisIsraeliItalianJamaicanJapaneseJordanianKenyanKiowaKoreanLaotianLatvianLebaneseLiberianLithuanianLumbeeLuxembourgerMacedonianMalaysianMalteseMarshalleseMenomineeMexicanMexican American IndianMongolianMoroccanNative HawaiianNavajoNepaleseNew ZealanderNicaraguanNigerianNorthern EuropeanNorwegianOkinawanOsageOttawaPaiutePakistaniPalestinianPanamanianParaguayanPennsylvania GermanPeruvianPimaPolishPortuguesePotawatomiPuebloPuerto RicanPuget Sound SalishRomanianRussianSalvadoranSamoanScandinavianScotch-IrishScottishSeminoleSenegaleseSerbianShoshoneSierra LeoneanSiouxSlavicSlovakSloveneSomaliSouth AfricanSouth AmericanSouth American IndianSoviet UnionSpaniardSpanishSpanish AmericanSpanish American IndianSri LankanSubsaharan AfricanSudaneseSwedishSwissSyrianTaiwaneseThaiTlingit-HaidaTohono O'OdhamTonganTrinidadian and TobagonianTsimshianTurkishU.S. Virgin IslanderUgandanUkrainianUruguayanUteVenezuelanVietnameseWelshWest IndianYakamaYaquiYugoslavianYumanYup'ikZimbabwean
Immigration
NonimmigrantsImmigrantsAfghanistanAfricaAlbaniaArgentinaArmeniaAsiaAustraliaAustriaBahamasBangladeshBarbadosBelarusBelgiumBelizeBoliviaBosnia and HerzegovinaBrazilBulgariaBurma/MyanmarCabo VerdeCambodiaCameroonCanadaCaribbeanCentral AmericaChileChinaColombiaCongoCosta RicaCroatiaCubaCzechoslovakiaDenmarkDominicaDominican RepublicEastern AfricaEastern AsiaEastern EuropeEcuadorEgyptEl SalvadorEnglandEritreaEthiopiaEuropeFijiFranceGermanyGhanaGreeceGrenadaGuatemalaGuyanaHaitiHondurasHong KongHungaryIndiaIndonesiaIranIraqIrelandIsraelItalyJamaicaJapanJordanKazakhstanKenyaKoreaKuwaitLaosLatin AmericaLatviaLebanonLiberiaLithuaniaMalaysiaMexicoMicronesiaMiddle AfricaMoldovaMoroccoNepalNetherlandsNicaraguaNigeriaNorth AmericaNorth MacedoniaNorthern AfricaNorthern EuropeNorwayOceaniaPakistanPanamaPeruPhilippinesPortugalRomaniaRussiaSaudi ArabiaScotlandSenegalSerbiaSierra LeoneSingaporeSomaliaSouth AfricaSouth AmericaSouth Central AsiaSouth Eastern AsiaSouthern EuropeSpainSri LankaSt. Vincent and the GrenadinesSudanSwedenSwitzerlandSyriaTaiwanThailandTrinidad and TobagoTurkeyUgandaUkraineUruguayUzbekistanVenezuelaVietnamWest IndiesWestern AfricaWestern AsiaWestern EuropeYemenZaireZimbabweAzores
Married-Couple Family Poverty
Income
Poverty
Unemployment
Labor Participation
Family Structure
Vehicle Availability
Education Level
Disability

Immigrants from Poland Married-Couple Family Poverty
Exceptional

4.6%
POVERTY | MARRIED-COUPLE FAMILIES
98.3/ 100
METRIC RATING
96th/ 347
METRIC RANK

Immigrants from Poland Married-Couple Family Poverty Correlation Chart

The statistical analysis conducted on geographies consisting of 302,218,163 people shows no correlation between the proportion of Immigrants from Poland and poverty level among married-couple families in the United States with a correlation coefficient (R) of 0.038 and weighted average of 4.6%. On average, for every 1% (one percent) increase in Immigrants from Poland within a typical geography, there is an increase of 0.015% in poverty level among married-couple families.
Immigrants from Poland Married-Couple Family Poverty
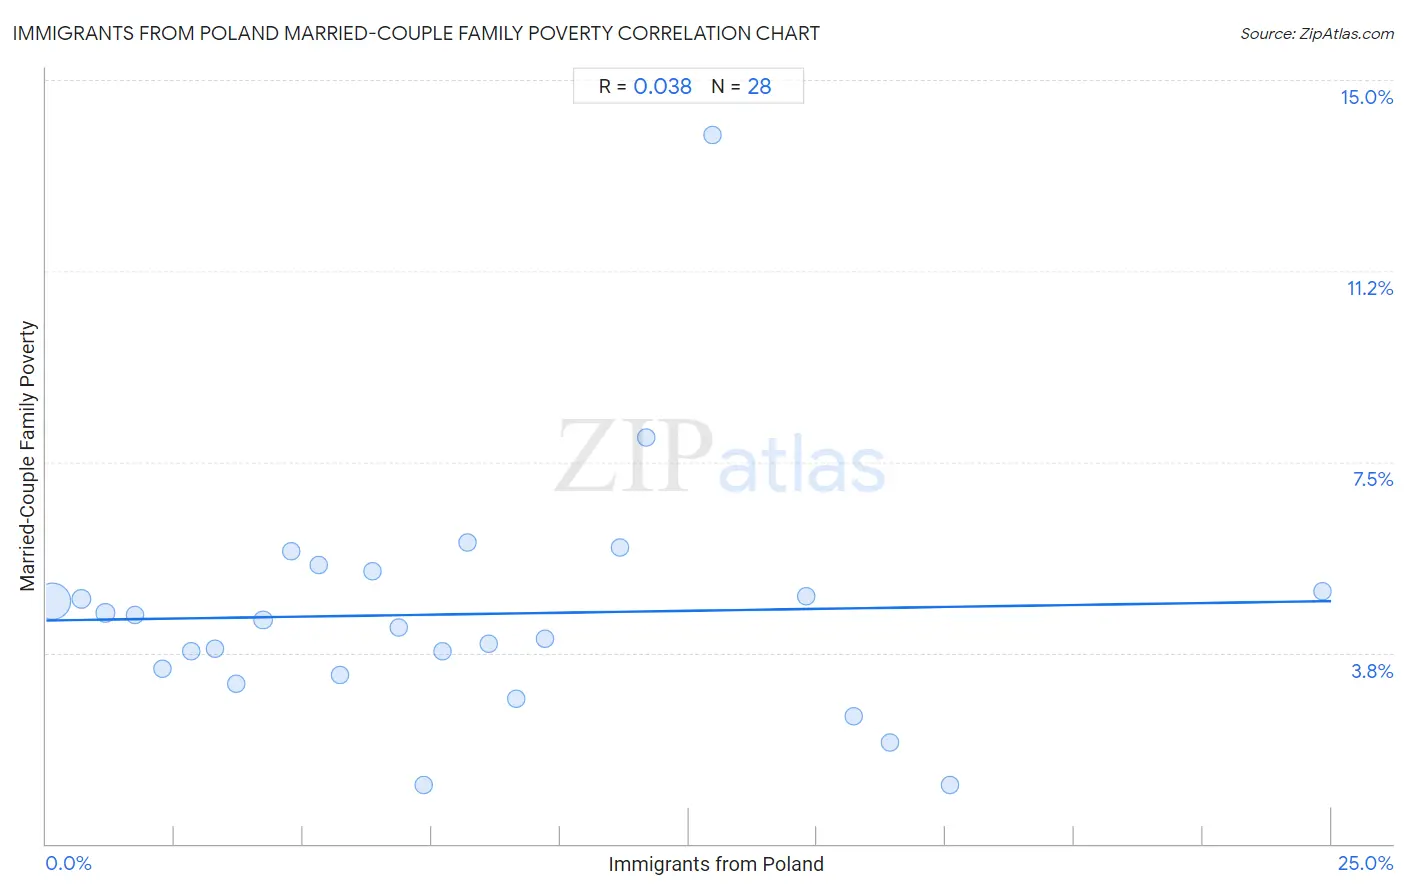
It is essential to understand that the correlation between the percentage of Immigrants from Poland and poverty level among married-couple families does not imply a direct cause-and-effect relationship. It remains uncertain whether the presence of Immigrants from Poland influences an upward or downward trend in the level of poverty level among married-couple families within an area, or if Immigrants from Poland simply ended up residing in those areas with higher or lower levels of poverty level among married-couple families due to other factors.

Demographics Similar to Immigrants from Poland by Married-Couple Family Poverty

In terms of married-couple family poverty, the demographic groups most similar to Immigrants from Poland are Immigrants from Belgium (4.6%, a difference of 0.050%), Portuguese (4.6%, a difference of 0.080%), Immigrants from Italy (4.6%, a difference of 0.12%), Korean (4.6%, a difference of 0.17%), and Immigrants from Norway (4.6%, a difference of 0.35%).
DemographicsRating | RankMarried-Couple Family Poverty
Immigrants from Czechoslovakia
98.5
/100
|
#89
Exceptional
4.6%
Immigrants from Switzerland
98.5
/100
|
#90
Exceptional
4.6%
Basques
98.5
/100
|
#91
Exceptional
4.6%
Immigrants from Norway
98.4
/100
|
#92
Exceptional
4.6%
Koreans
98.3
/100
|
#93
Exceptional
4.6%
Immigrants from Italy
98.3
/100
|
#94
Exceptional
4.6%
Portuguese
98.3
/100
|
#95
Exceptional
4.6%
Immigrants from Poland
98.3
/100
|
#96
Exceptional
4.6%
Immigrants from Belgium
98.2
/100
|
#97
Exceptional
4.6%
Native Hawaiians
98.0
/100
|
#98
Exceptional
4.6%
Immigrants from Europe
97.9
/100
|
#99
Exceptional
4.6%
Immigrants from Western Europe
97.9
/100
|
#100
Exceptional
4.6%
Yugoslavians
97.8
/100
|
#101
Exceptional
4.6%
Asians
97.6
/100
|
#102
Exceptional
4.7%
Immigrants from Romania
97.3
/100
|
#103
Exceptional
4.7%

Immigrants from Poland Married-Couple Family Poverty Correlation Summary

MeasurementImmigrants from Poland DataMarried-Couple Family Poverty Data
Minimum0.11%1.2%
Maximum24.8%13.9%
Range24.7%12.8%
Mean8.0%4.5%
Median7.1%4.3%
Interquartile 25% (IQ1)3.5%3.4%
Interquartile 75% (IQ3)11.4%5.2%
Interquartile Range (IQR)7.9%1.8%
Standard Deviation (Sample)5.9%2.4%
Standard Deviation (Population)5.8%2.3%

Correlation Details

Immigrants from Poland PercentileSample SizeMarried-Couple Family Poverty
[
0.0%
-
0.5%
]
0.11%
275,335,0054.8%
[
0.5%
-
1.0%
]
0.69%
14,292,0384.8%
[
1.0%
-
1.5%
]
1.15%
6,541,6734.5%
[
1.5%
-
2.0%
]
1.72%
1,408,9264.5%
[
2.0%
-
2.5%
]
2.27%
853,4213.4%
[
2.5%
-
3.0%
]
2.81%
853,0933.8%
[
3.0%
-
3.5%
]
3.27%
536,4663.8%
[
3.5%
-
4.0%
]
3.69%
315,6783.1%
[
4.0%
-
4.5%
]
4.22%
501,5404.4%
[
4.5%
-
5.0%
]
4.76%
114,9515.7%
[
5.0%
-
5.5%
]
5.30%
211,7565.5%
[
5.5%
-
6.0%
]
5.71%
262,8833.3%
[
6.0%
-
6.5%
]
6.34%
118,4475.4%
[
6.5%
-
7.0%
]
6.86%
71,7504.2%
[
7.0%
-
7.5%
]
7.35%
25,3901.2%
[
7.5%
-
8.0%
]
7.70%
77,5953.8%
[
8.0%
-
8.5%
]
8.20%
68,2975.9%
[
8.5%
-
9.0%
]
8.62%
168,6373.9%
[
9.0%
-
9.5%
]
9.14%
59,5302.9%
[
9.5%
-
10.0%
]
9.70%
48,3084.0%
[
11.0%
-
11.5%
]
11.15%
208,3565.8%
[
11.5%
-
12.0%
]
11.68%
36,5568.0%
[
12.5%
-
13.0%
]
12.96%
12,52513.9%
[
14.5%
-
15.0%
]
14.78%
23,2004.9%
[
15.5%
-
16.0%
]
15.72%
15,2912.5%
[
16.0%
-
16.5%
]
16.40%
24,2332.0%
[
17.5%
-
18.0%
]
17.58%
8,9421.2%
[
24.5%
-
25.0%
]
24.82%
23,6765.0%