Delaware Married-Couple Family Poverty
COMPARE
Delaware
Select to Compare
Married-Couple Family Poverty
Delaware Married-Couple Family Poverty
5.1%
POVERTY | MARRIED-COUPLE FAMILIES
73.7/ 100
METRIC RATING
154th/ 347
METRIC RANK
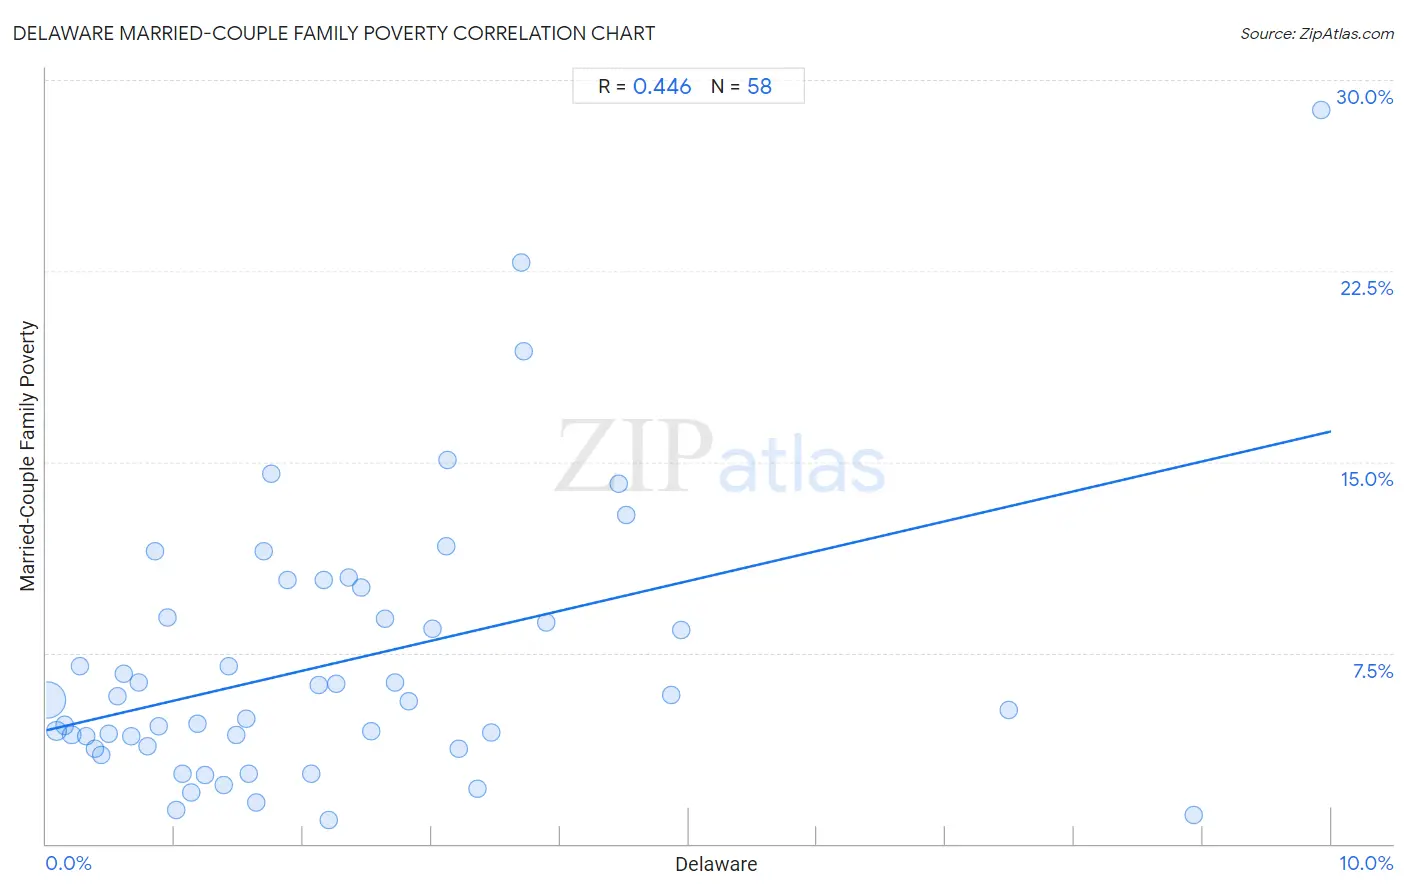
Delaware Married-Couple Family Poverty Correlation Chart
The statistical analysis conducted on geographies consisting of 95,946,385 people shows a moderate positive correlation between the proportion of Delaware and poverty level among married-couple families in the United States with a correlation coefficient (R) of 0.446 and weighted average of 5.1%. On average, for every 1% (one percent) increase in Delaware within a typical geography, there is an increase of 1.2% in poverty level among married-couple families.
It is essential to understand that the correlation between the percentage of Delaware and poverty level among married-couple families does not imply a direct cause-and-effect relationship. It remains uncertain whether the presence of Delaware influences an upward or downward trend in the level of poverty level among married-couple families within an area, or if Delaware simply ended up residing in those areas with higher or lower levels of poverty level among married-couple families due to other factors.
Demographics Similar to Delaware by Married-Couple Family Poverty
In terms of married-couple family poverty, the demographic groups most similar to Delaware are Immigrants from Ethiopia (5.1%, a difference of 0.19%), Sri Lankan (5.1%, a difference of 0.23%), Immigrants from Kuwait (5.0%, a difference of 0.43%), Argentinean (5.1%, a difference of 0.45%), and Immigrants from South Eastern Asia (5.1%, a difference of 0.49%).
| Demographics | Rating | Rank | Married-Couple Family Poverty |
| Syrians | 78.7 /100 | #147 | Good 5.0% |
| Immigrants from Russia | 78.7 /100 | #148 | Good 5.0% |
| Immigrants from Oceania | 78.6 /100 | #149 | Good 5.0% |
| Brazilians | 78.3 /100 | #150 | Good 5.0% |
| Immigrants from Cameroon | 77.3 /100 | #151 | Good 5.0% |
| Albanians | 77.2 /100 | #152 | Good 5.0% |
| Immigrants from Kuwait | 76.3 /100 | #153 | Good 5.0% |
| Delaware | 73.7 /100 | #154 | Good 5.1% |
| Immigrants from Ethiopia | 72.4 /100 | #155 | Good 5.1% |
| Sri Lankans | 72.2 /100 | #156 | Good 5.1% |
| Argentineans | 70.7 /100 | #157 | Good 5.1% |
| Immigrants from South Eastern Asia | 70.4 /100 | #158 | Good 5.1% |
| Immigrants from Saudi Arabia | 70.3 /100 | #159 | Good 5.1% |
| Pennsylvania Germans | 68.5 /100 | #160 | Good 5.1% |
| Ethiopians | 68.1 /100 | #161 | Good 5.1% |
Delaware Married-Couple Family Poverty Correlation Summary
| Measurement | Delaware Data | Married-Couple Family Poverty Data |
| Minimum | 0.012% | 0.94% |
| Maximum | 9.9% | 28.8% |
| Range | 9.9% | 27.9% |
| Mean | 2.2% | 7.1% |
| Median | 1.7% | 5.6% |
| Interquartile 25% (IQ1) | 0.84% | 3.8% |
| Interquartile 75% (IQ3) | 3.1% | 8.9% |
| Interquartile Range (IQR) | 2.3% | 5.1% |
| Standard Deviation (Sample) | 2.0% | 5.3% |
| Standard Deviation (Population) | 2.0% | 5.3% |
Correlation Details
| Delaware Percentile | Sample Size | Married-Couple Family Poverty |
[ 0.0% - 0.5% ] 0.012% | 80,462,353 | 5.7% |
[ 0.0% - 0.5% ] 0.079% | 8,417,911 | 4.4% |
[ 0.0% - 0.5% ] 0.14% | 2,642,791 | 4.7% |
[ 0.0% - 0.5% ] 0.20% | 1,542,816 | 4.3% |
[ 0.0% - 0.5% ] 0.26% | 702,897 | 7.0% |
[ 0.0% - 0.5% ] 0.31% | 447,956 | 4.2% |
[ 0.0% - 0.5% ] 0.37% | 409,640 | 3.7% |
[ 0.0% - 0.5% ] 0.42% | 284,168 | 3.5% |
[ 0.0% - 0.5% ] 0.49% | 178,036 | 4.3% |
[ 0.5% - 1.0% ] 0.55% | 184,641 | 5.8% |
[ 0.5% - 1.0% ] 0.60% | 155,173 | 6.7% |
[ 0.5% - 1.0% ] 0.66% | 65,138 | 4.2% |
[ 0.5% - 1.0% ] 0.72% | 86,511 | 6.3% |
[ 0.5% - 1.0% ] 0.79% | 60,100 | 3.8% |
[ 0.5% - 1.0% ] 0.84% | 13,520 | 11.5% |
[ 0.5% - 1.0% ] 0.88% | 18,021 | 4.6% |
[ 0.5% - 1.0% ] 0.95% | 18,296 | 8.9% |
[ 1.0% - 1.5% ] 1.01% | 14,050 | 1.3% |
[ 1.0% - 1.5% ] 1.06% | 48,358 | 2.7% |
[ 1.0% - 1.5% ] 1.13% | 11,146 | 2.0% |
[ 1.0% - 1.5% ] 1.18% | 39,987 | 4.7% |
[ 1.0% - 1.5% ] 1.23% | 22,979 | 2.7% |
[ 1.0% - 1.5% ] 1.38% | 3,550 | 2.3% |
[ 1.0% - 1.5% ] 1.42% | 3,379 | 6.9% |
[ 1.0% - 1.5% ] 1.48% | 7,085 | 4.3% |
[ 1.5% - 2.0% ] 1.56% | 1,541 | 4.9% |
[ 1.5% - 2.0% ] 1.57% | 1,400 | 2.7% |
[ 1.5% - 2.0% ] 1.64% | 27,017 | 1.6% |
[ 1.5% - 2.0% ] 1.70% | 2,239 | 11.5% |
[ 1.5% - 2.0% ] 1.75% | 4,912 | 14.5% |
[ 1.5% - 2.0% ] 1.87% | 9,024 | 10.3% |
[ 2.0% - 2.5% ] 2.06% | 2,135 | 2.7% |
[ 2.0% - 2.5% ] 2.12% | 2,450 | 6.2% |
[ 2.0% - 2.5% ] 2.16% | 2,917 | 10.3% |
[ 2.0% - 2.5% ] 2.20% | 12,277 | 0.94% |
[ 2.0% - 2.5% ] 2.26% | 1,373 | 6.3% |
[ 2.0% - 2.5% ] 2.35% | 1,914 | 10.4% |
[ 2.0% - 2.5% ] 2.45% | 4,238 | 10.1% |
[ 2.5% - 3.0% ] 2.53% | 3,914 | 4.4% |
[ 2.5% - 3.0% ] 2.63% | 1,216 | 8.8% |
[ 2.5% - 3.0% ] 2.72% | 1,177 | 6.3% |
[ 2.5% - 3.0% ] 2.82% | 3,194 | 5.6% |
[ 3.0% - 3.5% ] 3.00% | 1,499 | 8.5% |
[ 3.0% - 3.5% ] 3.11% | 2,315 | 11.7% |
[ 3.0% - 3.5% ] 3.12% | 2,304 | 15.1% |
[ 3.0% - 3.5% ] 3.21% | 436 | 3.7% |
[ 3.0% - 3.5% ] 3.36% | 1,460 | 2.2% |
[ 3.0% - 3.5% ] 3.46% | 4,475 | 4.4% |
[ 3.5% - 4.0% ] 3.70% | 460 | 22.8% |
[ 3.5% - 4.0% ] 3.72% | 1,938 | 19.4% |
[ 3.5% - 4.0% ] 3.89% | 822 | 8.7% |
[ 4.0% - 4.5% ] 4.46% | 359 | 14.2% |
[ 4.5% - 5.0% ] 4.51% | 532 | 12.9% |
[ 4.5% - 5.0% ] 4.86% | 2,303 | 5.8% |
[ 4.5% - 5.0% ] 4.94% | 587 | 8.4% |
[ 7.0% - 7.5% ] 7.49% | 2,002 | 5.2% |
[ 8.5% - 9.0% ] 8.93% | 929 | 1.1% |
[ 9.5% - 10.0% ] 9.92% | 524 | 28.8% |