Scotch-Irish Married-Couple Family Poverty
COMPARE
Scotch-Irish
Select to Compare
Married-Couple Family Poverty
Scotch-Irish Married-Couple Family Poverty
4.5%
POVERTY | MARRIED-COUPLE FAMILIES
99.1/ 100
METRIC RATING
78th/ 347
METRIC RANK
Scotch-Irish Married-Couple Family Poverty Correlation Chart
The statistical analysis conducted on geographies consisting of 536,697,572 people shows a strong positive correlation between the proportion of Scotch-Irish and poverty level among married-couple families in the United States with a correlation coefficient (R) of 0.773 and weighted average of 4.5%. On average, for every 1% (one percent) increase in Scotch-Irish within a typical geography, there is an increase of 0.81% in poverty level among married-couple families.
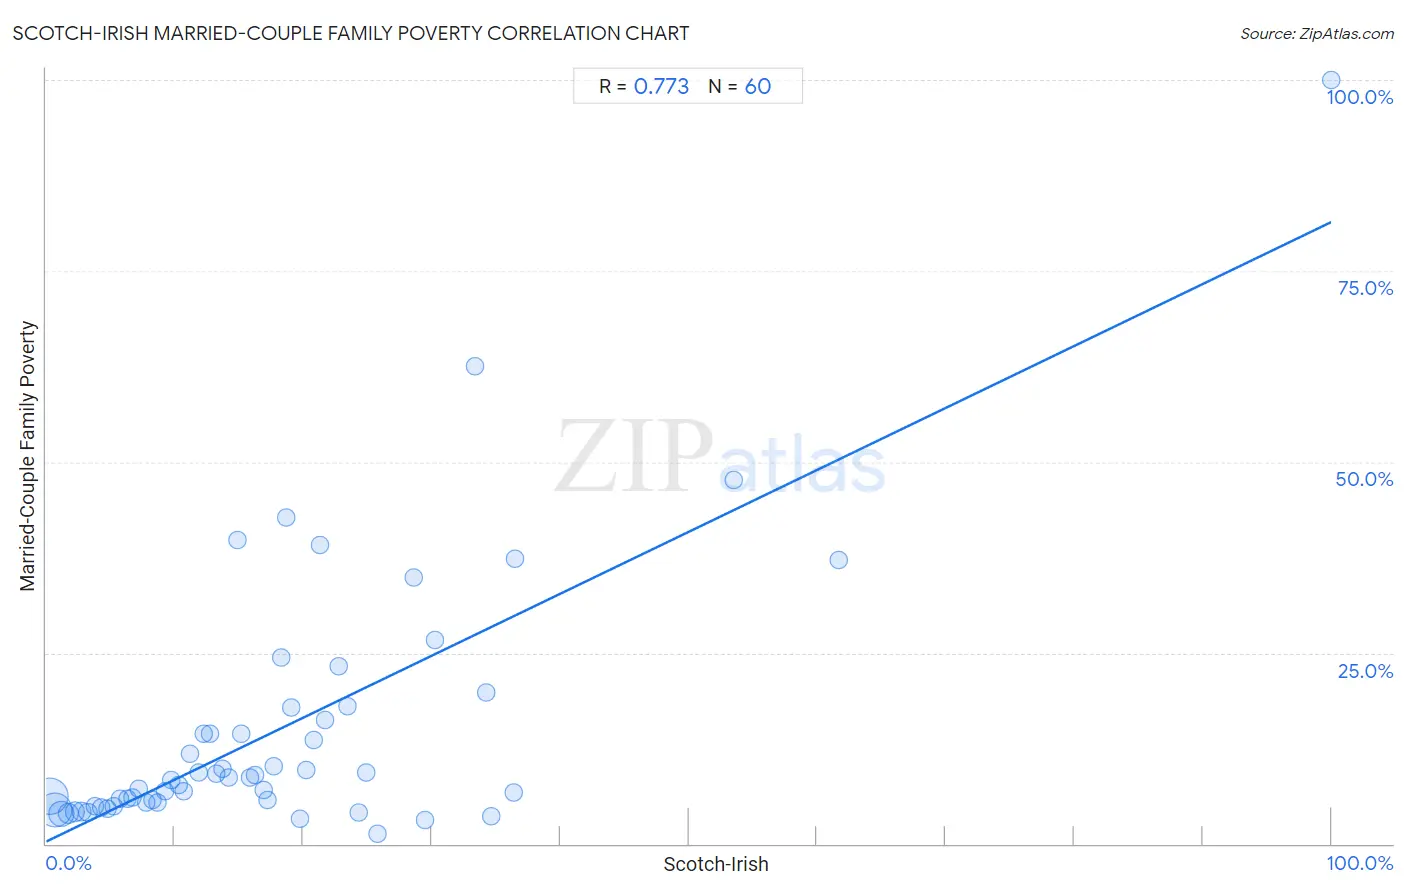
It is essential to understand that the correlation between the percentage of Scotch-Irish and poverty level among married-couple families does not imply a direct cause-and-effect relationship. It remains uncertain whether the presence of Scotch-Irish influences an upward or downward trend in the level of poverty level among married-couple families within an area, or if Scotch-Irish simply ended up residing in those areas with higher or lower levels of poverty level among married-couple families due to other factors.
Demographics Similar to Scotch-Irish by Married-Couple Family Poverty
In terms of married-couple family poverty, the demographic groups most similar to Scotch-Irish are Immigrants from Latvia (4.5%, a difference of 0.080%), Immigrants from Iran (4.5%, a difference of 0.23%), Immigrants from South Africa (4.5%, a difference of 0.25%), Icelander (4.5%, a difference of 0.29%), and Cambodian (4.5%, a difference of 0.36%).
| Demographics | Rating | Rank | Married-Couple Family Poverty |
| Immigrants from North America | 99.3 /100 | #71 | Exceptional 4.5% |
| Immigrants from England | 99.3 /100 | #72 | Exceptional 4.5% |
| Ukrainians | 99.2 /100 | #73 | Exceptional 4.5% |
| Immigrants from Austria | 99.2 /100 | #74 | Exceptional 4.5% |
| Cambodians | 99.2 /100 | #75 | Exceptional 4.5% |
| Immigrants from South Africa | 99.1 /100 | #76 | Exceptional 4.5% |
| Immigrants from Latvia | 99.1 /100 | #77 | Exceptional 4.5% |
| Scotch-Irish | 99.1 /100 | #78 | Exceptional 4.5% |
| Immigrants from Iran | 99.0 /100 | #79 | Exceptional 4.5% |
| Icelanders | 99.0 /100 | #80 | Exceptional 4.5% |
| Immigrants from Greece | 98.9 /100 | #81 | Exceptional 4.5% |
| Canadians | 98.8 /100 | #82 | Exceptional 4.5% |
| Immigrants from Denmark | 98.8 /100 | #83 | Exceptional 4.6% |
| Immigrants from Croatia | 98.7 /100 | #84 | Exceptional 4.6% |
| South Africans | 98.7 /100 | #85 | Exceptional 4.6% |
Scotch-Irish Married-Couple Family Poverty Correlation Summary
| Measurement | Scotch-Irish Data | Married-Couple Family Poverty Data |
| Minimum | 0.25% | 1.4% |
| Maximum | 100.0% | 100.0% |
| Range | 99.7% | 98.6% |
| Mean | 18.1% | 14.9% |
| Median | 15.0% | 8.5% |
| Interquartile 25% (IQ1) | 7.5% | 5.1% |
| Interquartile 75% (IQ3) | 23.1% | 17.0% |
| Interquartile Range (IQR) | 15.6% | 11.9% |
| Standard Deviation (Sample) | 16.4% | 17.2% |
| Standard Deviation (Population) | 16.3% | 17.1% |
Correlation Details
| Scotch-Irish Percentile | Sample Size | Married-Couple Family Poverty |
[ 0.0% - 0.5% ] 0.25% | 207,221,964 | 6.2% |
[ 0.5% - 1.0% ] 0.72% | 180,275,701 | 4.5% |
[ 1.0% - 1.5% ] 1.21% | 80,573,751 | 3.9% |
[ 1.5% - 2.0% ] 1.72% | 35,338,704 | 4.0% |
[ 2.0% - 2.5% ] 2.21% | 15,272,690 | 4.2% |
[ 2.5% - 3.0% ] 2.73% | 7,497,331 | 4.2% |
[ 3.0% - 3.5% ] 3.23% | 4,788,029 | 4.2% |
[ 3.5% - 4.0% ] 3.75% | 2,304,159 | 4.9% |
[ 4.0% - 4.5% ] 4.25% | 1,156,418 | 4.7% |
[ 4.5% - 5.0% ] 4.76% | 644,129 | 4.6% |
[ 5.0% - 5.5% ] 5.23% | 582,919 | 4.9% |
[ 5.5% - 6.0% ] 5.71% | 273,658 | 5.9% |
[ 6.0% - 6.5% ] 6.31% | 158,716 | 5.9% |
[ 6.5% - 7.0% ] 6.71% | 111,108 | 6.0% |
[ 7.0% - 7.5% ] 7.20% | 81,505 | 7.2% |
[ 7.5% - 8.0% ] 7.79% | 91,515 | 5.4% |
[ 8.0% - 8.5% ] 8.23% | 59,824 | 5.7% |
[ 8.5% - 9.0% ] 8.70% | 43,312 | 5.4% |
[ 9.0% - 9.5% ] 9.22% | 22,289 | 6.9% |
[ 9.5% - 10.0% ] 9.75% | 33,532 | 8.3% |
[ 10.0% - 10.5% ] 10.27% | 33,543 | 7.8% |
[ 10.5% - 11.0% ] 10.68% | 18,524 | 6.8% |
[ 11.0% - 11.5% ] 11.19% | 9,556 | 11.7% |
[ 11.5% - 12.0% ] 11.86% | 10,132 | 9.4% |
[ 12.0% - 12.5% ] 12.28% | 2,435 | 14.4% |
[ 12.5% - 13.0% ] 12.75% | 2,666 | 14.4% |
[ 13.0% - 13.5% ] 13.22% | 16,128 | 9.2% |
[ 13.5% - 14.0% ] 13.71% | 13,551 | 9.8% |
[ 14.0% - 14.5% ] 14.22% | 13,436 | 8.7% |
[ 14.5% - 15.0% ] 14.85% | 1,091 | 39.8% |
[ 15.0% - 15.5% ] 15.15% | 4,520 | 14.3% |
[ 15.5% - 16.0% ] 15.86% | 3,833 | 8.7% |
[ 16.0% - 16.5% ] 16.24% | 6,849 | 9.0% |
[ 16.5% - 17.0% ] 16.89% | 3,505 | 7.0% |
[ 17.0% - 17.5% ] 17.26% | 3,794 | 5.7% |
[ 17.5% - 18.0% ] 17.66% | 7,790 | 10.1% |
[ 18.0% - 18.5% ] 18.30% | 519 | 24.4% |
[ 18.5% - 19.0% ] 18.63% | 1,696 | 42.7% |
[ 19.0% - 19.5% ] 19.11% | 874 | 17.8% |
[ 19.5% - 20.0% ] 19.71% | 974 | 3.3% |
[ 20.0% - 20.5% ] 20.27% | 291 | 9.6% |
[ 20.5% - 21.0% ] 20.79% | 1,539 | 13.6% |
[ 21.0% - 21.5% ] 21.32% | 699 | 39.1% |
[ 21.5% - 22.0% ] 21.73% | 939 | 16.2% |
[ 22.5% - 23.0% ] 22.72% | 832 | 23.3% |
[ 23.0% - 23.5% ] 23.48% | 903 | 18.1% |
[ 24.0% - 24.5% ] 24.34% | 189 | 4.1% |
[ 24.5% - 25.0% ] 24.89% | 1,571 | 9.4% |
[ 25.5% - 26.0% ] 25.80% | 407 | 1.4% |
[ 28.5% - 29.0% ] 28.57% | 112 | 34.9% |
[ 29.0% - 29.5% ] 29.49% | 217 | 3.2% |
[ 30.0% - 30.5% ] 30.28% | 885 | 26.7% |
[ 33.0% - 33.5% ] 33.33% | 36 | 62.5% |
[ 34.0% - 34.5% ] 34.22% | 450 | 19.8% |
[ 34.5% - 35.0% ] 34.59% | 185 | 3.7% |
[ 36.0% - 36.5% ] 36.40% | 728 | 6.7% |
[ 36.5% - 37.0% ] 36.51% | 556 | 37.2% |
[ 53.5% - 54.0% ] 53.51% | 299 | 47.6% |
[ 61.5% - 62.0% ] 61.67% | 60 | 37.1% |
[ 99.5% - 100.0% ] 100.00% | 4 | 100.0% |