Immigrants from Mexico Married-Couple Family Poverty
COMPARE
Immigrants from Mexico
Select to Compare
Married-Couple Family Poverty
Immigrants from Mexico Married-Couple Family Poverty
7.6%
POVERTY | MARRIED-COUPLE FAMILIES
0.0/ 100
METRIC RATING
328th/ 347
METRIC RANK
Immigrants from Mexico Married-Couple Family Poverty Correlation Chart
The statistical analysis conducted on geographies consisting of 506,470,232 people shows a strong positive correlation between the proportion of Immigrants from Mexico and poverty level among married-couple families in the United States with a correlation coefficient (R) of 0.711 and weighted average of 7.6%. On average, for every 1% (one percent) increase in Immigrants from Mexico within a typical geography, there is an increase of 0.77% in poverty level among married-couple families.
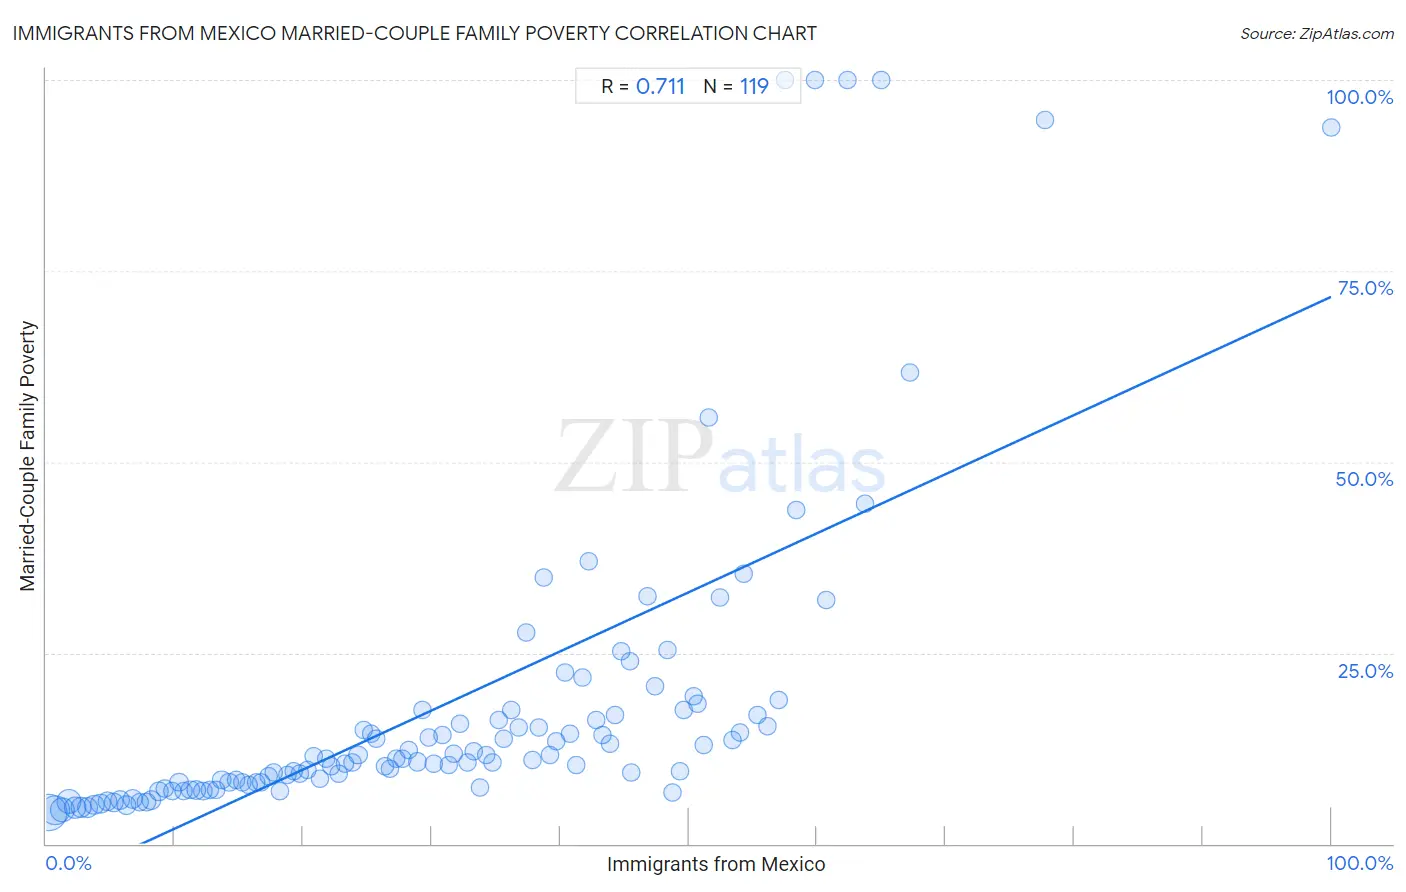
It is essential to understand that the correlation between the percentage of Immigrants from Mexico and poverty level among married-couple families does not imply a direct cause-and-effect relationship. It remains uncertain whether the presence of Immigrants from Mexico influences an upward or downward trend in the level of poverty level among married-couple families within an area, or if Immigrants from Mexico simply ended up residing in those areas with higher or lower levels of poverty level among married-couple families due to other factors.
Demographics Similar to Immigrants from Mexico by Married-Couple Family Poverty
In terms of married-couple family poverty, the demographic groups most similar to Immigrants from Mexico are Immigrants from Bangladesh (7.5%, a difference of 1.2%), Hispanic or Latino (7.5%, a difference of 1.2%), Immigrants from Cuba (7.5%, a difference of 1.4%), Immigrants from Central America (7.4%, a difference of 2.0%), and Vietnamese (7.4%, a difference of 2.1%).
| Demographics | Rating | Rank | Married-Couple Family Poverty |
| Immigrants from Caribbean | 0.0 /100 | #321 | Tragic 7.3% |
| Immigrants from Honduras | 0.0 /100 | #322 | Tragic 7.3% |
| Vietnamese | 0.0 /100 | #323 | Tragic 7.4% |
| Immigrants from Central America | 0.0 /100 | #324 | Tragic 7.4% |
| Immigrants from Cuba | 0.0 /100 | #325 | Tragic 7.5% |
| Immigrants from Bangladesh | 0.0 /100 | #326 | Tragic 7.5% |
| Hispanics or Latinos | 0.0 /100 | #327 | Tragic 7.5% |
| Immigrants from Mexico | 0.0 /100 | #328 | Tragic 7.6% |
| Natives/Alaskans | 0.0 /100 | #329 | Tragic 8.2% |
| Paiute | 0.0 /100 | #330 | Tragic 8.3% |
| Central American Indians | 0.0 /100 | #331 | Tragic 8.3% |
| Dominicans | 0.0 /100 | #332 | Tragic 8.3% |
| Lumbee | 0.0 /100 | #333 | Tragic 8.3% |
| Immigrants from Dominican Republic | 0.0 /100 | #334 | Tragic 8.4% |
| Sioux | 0.0 /100 | #335 | Tragic 8.7% |
Immigrants from Mexico Married-Couple Family Poverty Correlation Summary
| Measurement | Immigrants from Mexico Data | Married-Couple Family Poverty Data |
| Minimum | 0.24% | 4.1% |
| Maximum | 100.0% | 100.0% |
| Range | 99.8% | 95.9% |
| Mean | 30.8% | 18.1% |
| Median | 29.7% | 11.1% |
| Interquartile 25% (IQ1) | 14.8% | 7.8% |
| Interquartile 75% (IQ3) | 44.7% | 16.8% |
| Interquartile Range (IQR) | 29.9% | 9.1% |
| Standard Deviation (Sample) | 19.3% | 21.0% |
| Standard Deviation (Population) | 19.2% | 21.0% |
Correlation Details
| Immigrants from Mexico Percentile | Sample Size | Married-Couple Family Poverty |
[ 0.0% - 0.5% ] 0.24% | 131,812,207 | 4.1% |
[ 0.5% - 1.0% ] 0.73% | 76,335,564 | 4.4% |
[ 1.0% - 1.5% ] 1.22% | 45,664,919 | 4.5% |
[ 1.5% - 2.0% ] 1.77% | 41,127,216 | 5.5% |
[ 2.0% - 2.5% ] 2.24% | 23,825,337 | 4.7% |
[ 2.5% - 3.0% ] 2.75% | 19,439,054 | 4.8% |
[ 3.0% - 3.5% ] 3.24% | 16,449,634 | 4.8% |
[ 3.5% - 4.0% ] 3.73% | 11,219,612 | 5.1% |
[ 4.0% - 4.5% ] 4.23% | 9,851,970 | 5.2% |
[ 4.5% - 5.0% ] 4.74% | 8,554,192 | 5.6% |
[ 5.0% - 5.5% ] 5.22% | 9,044,956 | 5.3% |
[ 5.5% - 6.0% ] 5.75% | 7,583,111 | 5.7% |
[ 6.0% - 6.5% ] 6.23% | 6,214,199 | 5.0% |
[ 6.5% - 7.0% ] 6.75% | 5,793,925 | 5.8% |
[ 7.0% - 7.5% ] 7.27% | 4,424,823 | 5.4% |
[ 7.5% - 8.0% ] 7.82% | 5,407,607 | 5.4% |
[ 8.0% - 8.5% ] 8.20% | 7,100,334 | 5.7% |
[ 8.5% - 9.0% ] 8.79% | 7,180,360 | 6.9% |
[ 9.0% - 9.5% ] 9.21% | 3,838,893 | 7.2% |
[ 9.5% - 10.0% ] 9.79% | 2,623,731 | 6.9% |
[ 10.0% - 10.5% ] 10.32% | 4,553,032 | 8.1% |
[ 10.5% - 11.0% ] 10.71% | 2,700,804 | 6.9% |
[ 11.0% - 11.5% ] 11.23% | 3,275,720 | 7.1% |
[ 11.5% - 12.0% ] 11.69% | 8,233,575 | 7.0% |
[ 12.0% - 12.5% ] 12.20% | 2,780,547 | 6.9% |
[ 12.5% - 13.0% ] 12.73% | 2,216,927 | 7.1% |
[ 13.0% - 13.5% ] 13.26% | 1,661,094 | 7.1% |
[ 13.5% - 14.0% ] 13.65% | 2,709,978 | 8.4% |
[ 14.0% - 14.5% ] 14.23% | 2,398,269 | 8.0% |
[ 14.5% - 15.0% ] 14.76% | 1,564,203 | 8.3% |
[ 15.0% - 15.5% ] 15.28% | 1,796,570 | 8.1% |
[ 15.5% - 16.0% ] 15.74% | 1,461,566 | 7.8% |
[ 16.0% - 16.5% ] 16.30% | 1,599,877 | 8.0% |
[ 16.5% - 17.0% ] 16.73% | 2,367,968 | 8.1% |
[ 17.0% - 17.5% ] 17.28% | 1,353,177 | 8.8% |
[ 17.5% - 18.0% ] 17.73% | 1,134,584 | 9.4% |
[ 18.0% - 18.5% ] 18.21% | 1,128,698 | 6.8% |
[ 18.5% - 19.0% ] 18.73% | 1,247,295 | 9.0% |
[ 19.0% - 19.5% ] 19.24% | 744,375 | 9.5% |
[ 19.5% - 20.0% ] 19.77% | 1,838,721 | 9.2% |
[ 20.0% - 20.5% ] 20.29% | 1,025,290 | 9.7% |
[ 20.5% - 21.0% ] 20.78% | 578,678 | 11.4% |
[ 21.0% - 21.5% ] 21.30% | 819,350 | 8.4% |
[ 21.5% - 22.0% ] 21.75% | 658,953 | 11.1% |
[ 22.0% - 22.5% ] 22.21% | 730,931 | 10.1% |
[ 22.5% - 23.0% ] 22.75% | 877,622 | 9.2% |
[ 23.0% - 23.5% ] 23.28% | 1,154,958 | 10.5% |
[ 23.5% - 24.0% ] 23.79% | 592,821 | 10.6% |
[ 24.0% - 24.5% ] 24.27% | 458,845 | 11.6% |
[ 24.5% - 25.0% ] 24.72% | 324,125 | 14.9% |
[ 25.0% - 25.5% ] 25.30% | 710,077 | 14.4% |
[ 25.5% - 26.0% ] 25.69% | 668,401 | 13.7% |
[ 26.0% - 26.5% ] 26.35% | 333,360 | 10.1% |
[ 26.5% - 27.0% ] 26.78% | 525,680 | 9.9% |
[ 27.0% - 27.5% ] 27.22% | 723,699 | 11.1% |
[ 27.5% - 28.0% ] 27.70% | 462,981 | 11.1% |
[ 28.0% - 28.5% ] 28.20% | 381,796 | 12.3% |
[ 28.5% - 29.0% ] 28.85% | 697,069 | 10.7% |
[ 29.0% - 29.5% ] 29.24% | 777,764 | 17.5% |
[ 29.5% - 30.0% ] 29.72% | 253,929 | 13.9% |
[ 30.0% - 30.5% ] 30.14% | 281,180 | 10.4% |
[ 30.5% - 31.0% ] 30.80% | 271,124 | 14.2% |
[ 31.0% - 31.5% ] 31.28% | 124,066 | 10.4% |
[ 31.5% - 32.0% ] 31.74% | 261,195 | 11.9% |
[ 32.0% - 32.5% ] 32.20% | 187,830 | 15.7% |
[ 32.5% - 33.0% ] 32.81% | 536,956 | 10.6% |
[ 33.0% - 33.5% ] 33.22% | 127,873 | 12.1% |
[ 33.5% - 34.0% ] 33.71% | 49,590 | 7.3% |
[ 34.0% - 34.5% ] 34.26% | 239,297 | 11.7% |
[ 34.5% - 35.0% ] 34.76% | 402,885 | 10.6% |
[ 35.0% - 35.5% ] 35.19% | 59,416 | 16.2% |
[ 35.5% - 36.0% ] 35.65% | 8,098 | 13.8% |
[ 36.0% - 36.5% ] 36.21% | 82,578 | 17.5% |
[ 36.5% - 37.0% ] 36.73% | 51,960 | 15.2% |
[ 37.0% - 37.5% ] 37.31% | 4,731 | 27.6% |
[ 37.5% - 38.0% ] 37.86% | 41,246 | 11.0% |
[ 38.0% - 38.5% ] 38.29% | 93,203 | 15.2% |
[ 38.5% - 39.0% ] 38.67% | 8,169 | 34.8% |
[ 39.0% - 39.5% ] 39.22% | 115,490 | 11.6% |
[ 39.5% - 40.0% ] 39.72% | 55,724 | 13.4% |
[ 40.0% - 40.5% ] 40.34% | 7,721 | 22.5% |
[ 40.5% - 41.0% ] 40.79% | 97,738 | 14.4% |
[ 41.0% - 41.5% ] 41.27% | 78,330 | 10.3% |
[ 41.5% - 42.0% ] 41.76% | 1,966 | 21.7% |
[ 42.0% - 42.5% ] 42.22% | 14,497 | 37.0% |
[ 42.5% - 43.0% ] 42.84% | 29,860 | 16.2% |
[ 43.0% - 43.5% ] 43.31% | 28,942 | 14.2% |
[ 43.5% - 44.0% ] 43.84% | 2,012 | 13.1% |
[ 44.0% - 44.5% ] 44.29% | 63,316 | 16.8% |
[ 44.5% - 45.0% ] 44.71% | 4,974 | 25.2% |
[ 45.0% - 45.5% ] 45.40% | 23,736 | 23.9% |
[ 45.5% - 46.0% ] 45.57% | 28,782 | 9.3% |
[ 46.5% - 47.0% ] 46.77% | 8,182 | 32.4% |
[ 47.0% - 47.5% ] 47.36% | 6,676 | 20.6% |
[ 48.0% - 48.5% ] 48.36% | 670 | 25.4% |
[ 48.5% - 49.0% ] 48.71% | 10,108 | 6.7% |
[ 49.0% - 49.5% ] 49.33% | 892 | 9.4% |
[ 49.5% - 50.0% ] 49.59% | 3,081 | 17.5% |
[ 50.0% - 50.5% ] 50.37% | 3,480 | 19.4% |
[ 50.5% - 51.0% ] 50.67% | 1,352 | 18.4% |
[ 51.0% - 51.5% ] 51.16% | 2,416 | 13.0% |
[ 51.5% - 52.0% ] 51.51% | 860 | 55.8% |
[ 52.0% - 52.5% ] 52.40% | 1,540 | 32.3% |
[ 53.0% - 53.5% ] 53.45% | 3,422 | 13.6% |
[ 53.5% - 54.0% ] 53.99% | 9,412 | 14.5% |
[ 54.0% - 54.5% ] 54.29% | 1,234 | 35.4% |
[ 55.0% - 55.5% ] 55.33% | 13,346 | 16.8% |
[ 56.0% - 56.5% ] 56.13% | 1,404 | 15.4% |
[ 56.5% - 57.0% ] 56.96% | 316 | 18.8% |
[ 57.5% - 58.0% ] 57.52% | 113 | 100.0% |
[ 58.0% - 58.5% ] 58.35% | 922 | 43.7% |
[ 59.5% - 60.0% ] 59.83% | 117 | 100.0% |
[ 60.5% - 61.0% ] 60.71% | 425 | 32.0% |
[ 62.0% - 62.5% ] 62.37% | 194 | 100.0% |
[ 63.5% - 64.0% ] 63.71% | 248 | 44.4% |
[ 65.0% - 65.5% ] 65.00% | 40 | 100.0% |
[ 67.0% - 67.5% ] 67.19% | 128 | 61.7% |
[ 77.5% - 78.0% ] 77.68% | 112 | 94.7% |
[ 99.5% - 100.0% ] 100.00% | 104 | 93.8% |