Immigrants from Nicaragua Married-Couple Family Poverty
COMPARE
Immigrants from Nicaragua
Select to Compare
Married-Couple Family Poverty
Immigrants from Nicaragua Married-Couple Family Poverty
7.1%
POVERTY | MARRIED-COUPLE FAMILIES
0.0/ 100
METRIC RATING
310th/ 347
METRIC RANK
Immigrants from Nicaragua Married-Couple Family Poverty Correlation Chart
The statistical analysis conducted on geographies consisting of 235,581,482 people shows a weak positive correlation between the proportion of Immigrants from Nicaragua and poverty level among married-couple families in the United States with a correlation coefficient (R) of 0.208 and weighted average of 7.1%. On average, for every 1% (one percent) increase in Immigrants from Nicaragua within a typical geography, there is an increase of 0.25% in poverty level among married-couple families.
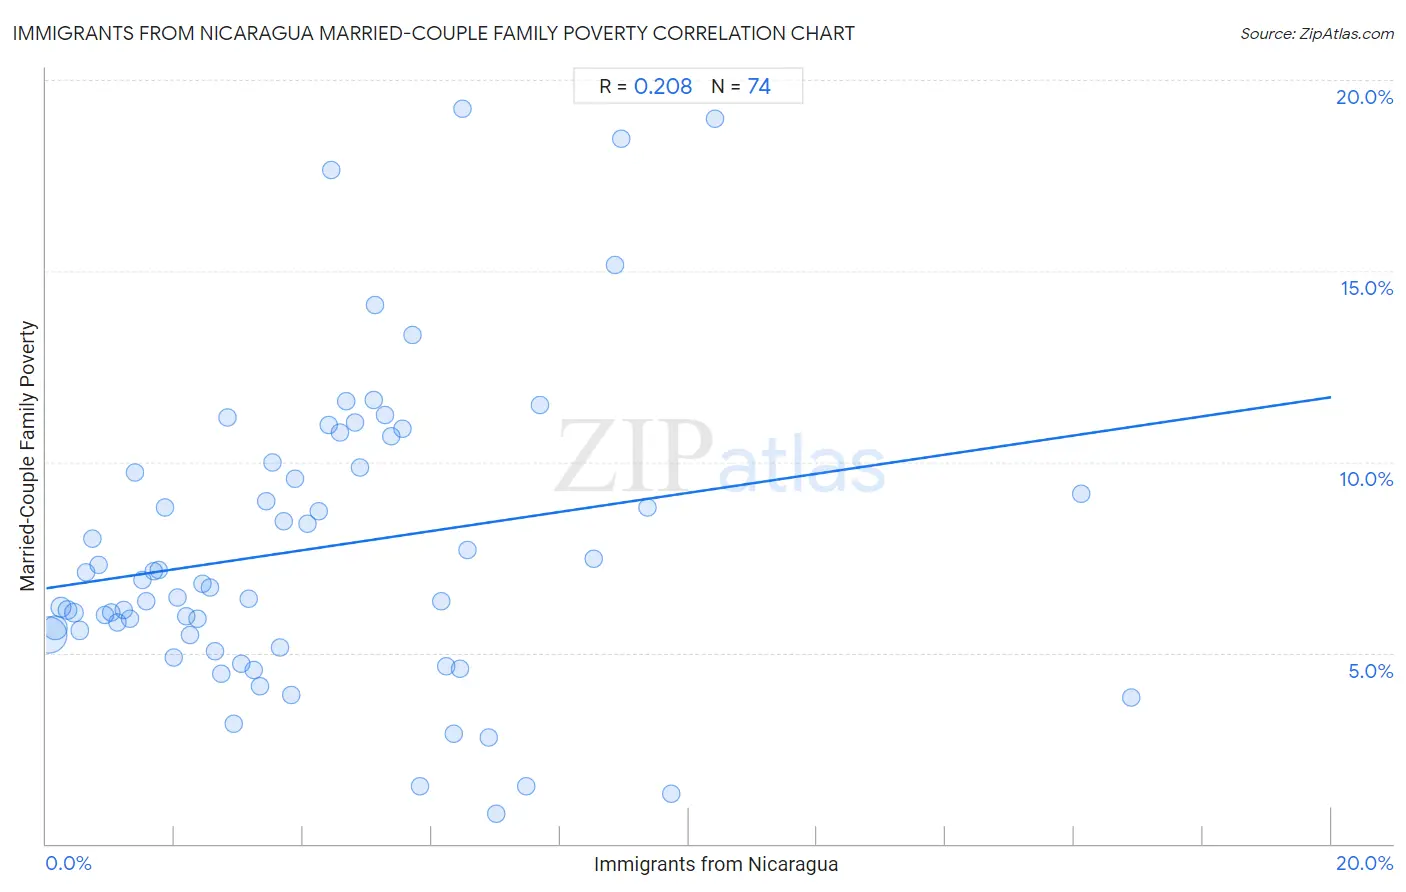
It is essential to understand that the correlation between the percentage of Immigrants from Nicaragua and poverty level among married-couple families does not imply a direct cause-and-effect relationship. It remains uncertain whether the presence of Immigrants from Nicaragua influences an upward or downward trend in the level of poverty level among married-couple families within an area, or if Immigrants from Nicaragua simply ended up residing in those areas with higher or lower levels of poverty level among married-couple families due to other factors.
Demographics Similar to Immigrants from Nicaragua by Married-Couple Family Poverty
In terms of married-couple family poverty, the demographic groups most similar to Immigrants from Nicaragua are Hopi (7.1%, a difference of 0.030%), Immigrants from Dominica (7.1%, a difference of 0.050%), Immigrants from Armenia (7.1%, a difference of 0.050%), Immigrants from St. Vincent and the Grenadines (7.1%, a difference of 0.17%), and British West Indian (7.1%, a difference of 0.47%).
| Demographics | Rating | Rank | Married-Couple Family Poverty |
| Immigrants from El Salvador | 0.0 /100 | #303 | Tragic 6.8% |
| Cubans | 0.0 /100 | #304 | Tragic 6.8% |
| Haitians | 0.0 /100 | #305 | Tragic 6.8% |
| Immigrants from Haiti | 0.0 /100 | #306 | Tragic 7.0% |
| Guatemalans | 0.0 /100 | #307 | Tragic 7.0% |
| Spanish American Indians | 0.0 /100 | #308 | Tragic 7.1% |
| Hopi | 0.0 /100 | #309 | Tragic 7.1% |
| Immigrants from Nicaragua | 0.0 /100 | #310 | Tragic 7.1% |
| Immigrants from Dominica | 0.0 /100 | #311 | Tragic 7.1% |
| Immigrants from Armenia | 0.0 /100 | #312 | Tragic 7.1% |
| Immigrants from St. Vincent and the Grenadines | 0.0 /100 | #313 | Tragic 7.1% |
| British West Indians | 0.0 /100 | #314 | Tragic 7.1% |
| Inupiat | 0.0 /100 | #315 | Tragic 7.1% |
| Hondurans | 0.0 /100 | #316 | Tragic 7.2% |
| Mexicans | 0.0 /100 | #317 | Tragic 7.2% |
Immigrants from Nicaragua Married-Couple Family Poverty Correlation Summary
| Measurement | Immigrants from Nicaragua Data | Married-Couple Family Poverty Data |
| Minimum | 0.043% | 0.79% |
| Maximum | 16.9% | 19.2% |
| Range | 16.8% | 18.4% |
| Mean | 4.2% | 7.7% |
| Median | 3.6% | 6.8% |
| Interquartile 25% (IQ1) | 1.8% | 5.5% |
| Interquartile 75% (IQ3) | 5.8% | 9.9% |
| Interquartile Range (IQR) | 4.1% | 4.4% |
| Standard Deviation (Sample) | 3.3% | 4.0% |
| Standard Deviation (Population) | 3.3% | 3.9% |
Correlation Details
| Immigrants from Nicaragua Percentile | Sample Size | Married-Couple Family Poverty |
[ 0.0% - 0.5% ] 0.043% | 137,661,258 | 5.5% |
[ 0.0% - 0.5% ] 0.14% | 42,440,535 | 5.7% |
[ 0.0% - 0.5% ] 0.23% | 21,931,263 | 6.2% |
[ 0.0% - 0.5% ] 0.33% | 9,219,565 | 6.1% |
[ 0.0% - 0.5% ] 0.43% | 6,532,044 | 6.1% |
[ 0.5% - 1.0% ] 0.53% | 3,453,001 | 5.6% |
[ 0.5% - 1.0% ] 0.62% | 2,751,876 | 7.1% |
[ 0.5% - 1.0% ] 0.72% | 1,651,806 | 8.0% |
[ 0.5% - 1.0% ] 0.81% | 1,748,927 | 7.3% |
[ 0.5% - 1.0% ] 0.92% | 928,444 | 6.0% |
[ 1.0% - 1.5% ] 1.01% | 672,509 | 6.1% |
[ 1.0% - 1.5% ] 1.12% | 609,909 | 5.8% |
[ 1.0% - 1.5% ] 1.21% | 498,679 | 6.1% |
[ 1.0% - 1.5% ] 1.30% | 495,770 | 5.9% |
[ 1.0% - 1.5% ] 1.38% | 286,244 | 9.7% |
[ 1.0% - 1.5% ] 1.50% | 466,011 | 6.9% |
[ 1.5% - 2.0% ] 1.56% | 259,298 | 6.4% |
[ 1.5% - 2.0% ] 1.68% | 283,270 | 7.1% |
[ 1.5% - 2.0% ] 1.75% | 30,318 | 7.2% |
[ 1.5% - 2.0% ] 1.85% | 214,541 | 8.8% |
[ 1.5% - 2.0% ] 1.98% | 59,292 | 4.9% |
[ 2.0% - 2.5% ] 2.05% | 266,876 | 6.4% |
[ 2.0% - 2.5% ] 2.17% | 28,966 | 6.0% |
[ 2.0% - 2.5% ] 2.23% | 59,190 | 5.5% |
[ 2.0% - 2.5% ] 2.35% | 43,119 | 5.9% |
[ 2.0% - 2.5% ] 2.42% | 248,977 | 6.8% |
[ 2.5% - 3.0% ] 2.55% | 173,321 | 6.7% |
[ 2.5% - 3.0% ] 2.62% | 64,444 | 5.0% |
[ 2.5% - 3.0% ] 2.72% | 55,241 | 4.5% |
[ 2.5% - 3.0% ] 2.82% | 22,823 | 11.2% |
[ 2.5% - 3.0% ] 2.92% | 103,539 | 3.2% |
[ 3.0% - 3.5% ] 3.03% | 140,810 | 4.7% |
[ 3.0% - 3.5% ] 3.16% | 133,452 | 6.4% |
[ 3.0% - 3.5% ] 3.23% | 118,950 | 4.5% |
[ 3.0% - 3.5% ] 3.33% | 19,994 | 4.1% |
[ 3.0% - 3.5% ] 3.43% | 176,909 | 9.0% |
[ 3.5% - 4.0% ] 3.52% | 225,637 | 10.0% |
[ 3.5% - 4.0% ] 3.64% | 4,098 | 5.1% |
[ 3.5% - 4.0% ] 3.69% | 93,900 | 8.5% |
[ 3.5% - 4.0% ] 3.81% | 4,987 | 3.9% |
[ 3.5% - 4.0% ] 3.87% | 78,900 | 9.5% |
[ 4.0% - 4.5% ] 4.06% | 60,592 | 8.4% |
[ 4.0% - 4.5% ] 4.24% | 49,662 | 8.7% |
[ 4.0% - 4.5% ] 4.40% | 44,062 | 11.0% |
[ 4.0% - 4.5% ] 4.44% | 496 | 17.6% |
[ 4.5% - 5.0% ] 4.58% | 63,650 | 10.8% |
[ 4.5% - 5.0% ] 4.67% | 444,748 | 11.6% |
[ 4.5% - 5.0% ] 4.80% | 49,347 | 11.0% |
[ 4.5% - 5.0% ] 4.88% | 105,852 | 9.9% |
[ 5.0% - 5.5% ] 5.09% | 47,065 | 11.6% |
[ 5.0% - 5.5% ] 5.11% | 30,980 | 14.1% |
[ 5.0% - 5.5% ] 5.28% | 45,620 | 11.2% |
[ 5.0% - 5.5% ] 5.36% | 1,604 | 10.7% |
[ 5.5% - 6.0% ] 5.54% | 85,736 | 10.9% |
[ 5.5% - 6.0% ] 5.69% | 14,698 | 13.3% |
[ 5.5% - 6.0% ] 5.83% | 309 | 1.5% |
[ 6.0% - 6.5% ] 6.14% | 5,049 | 6.4% |
[ 6.0% - 6.5% ] 6.22% | 16,776 | 4.7% |
[ 6.0% - 6.5% ] 6.34% | 867 | 2.9% |
[ 6.0% - 6.5% ] 6.44% | 34,335 | 4.6% |
[ 6.0% - 6.5% ] 6.47% | 59,121 | 19.2% |
[ 6.5% - 7.0% ] 6.56% | 457 | 7.7% |
[ 6.5% - 7.0% ] 6.89% | 740 | 2.8% |
[ 6.5% - 7.0% ] 7.00% | 443 | 0.79% |
[ 7.0% - 7.5% ] 7.46% | 469 | 1.5% |
[ 7.5% - 8.0% ] 7.69% | 390 | 11.5% |
[ 8.5% - 9.0% ] 8.53% | 40,278 | 7.5% |
[ 8.5% - 9.0% ] 8.86% | 34,742 | 15.2% |
[ 8.5% - 9.0% ] 8.96% | 54,873 | 18.5% |
[ 9.0% - 9.5% ] 9.37% | 630 | 8.8% |
[ 9.5% - 10.0% ] 9.73% | 514 | 1.3% |
[ 10.0% - 10.5% ] 10.40% | 8,989 | 19.0% |
[ 16.0% - 16.5% ] 16.11% | 19,399 | 9.2% |
[ 16.5% - 17.0% ] 16.89% | 296 | 3.8% |