Immigrants from Oceania Married-Couple Family Poverty
COMPARE
Immigrants from Oceania
Select to Compare
Married-Couple Family Poverty
Immigrants from Oceania Married-Couple Family Poverty
5.0%
POVERTY | MARRIED-COUPLE FAMILIES
78.6/ 100
METRIC RATING
149th/ 347
METRIC RANK
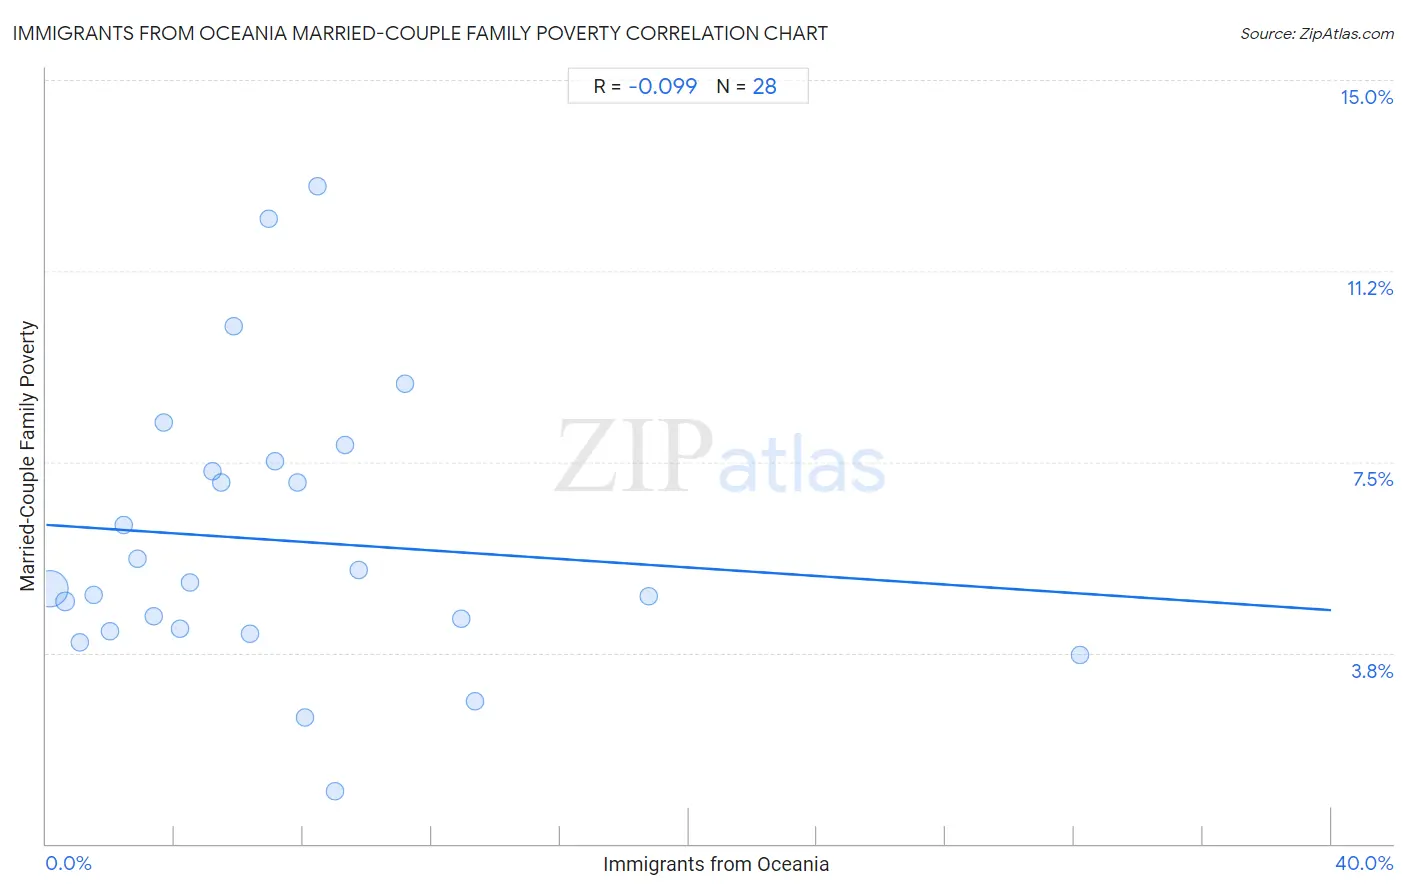
Immigrants from Oceania Married-Couple Family Poverty Correlation Chart
The statistical analysis conducted on geographies consisting of 303,370,151 people shows a slight negative correlation between the proportion of Immigrants from Oceania and poverty level among married-couple families in the United States with a correlation coefficient (R) of -0.099 and weighted average of 5.0%. On average, for every 1% (one percent) increase in Immigrants from Oceania within a typical geography, there is a decrease of 0.042% in poverty level among married-couple families.
It is essential to understand that the correlation between the percentage of Immigrants from Oceania and poverty level among married-couple families does not imply a direct cause-and-effect relationship. It remains uncertain whether the presence of Immigrants from Oceania influences an upward or downward trend in the level of poverty level among married-couple families within an area, or if Immigrants from Oceania simply ended up residing in those areas with higher or lower levels of poverty level among married-couple families due to other factors.
Demographics Similar to Immigrants from Oceania by Married-Couple Family Poverty
In terms of married-couple family poverty, the demographic groups most similar to Immigrants from Oceania are Syrian (5.0%, a difference of 0.030%), Immigrants from Russia (5.0%, a difference of 0.030%), Brazilian (5.0%, a difference of 0.050%), Mongolian (5.0%, a difference of 0.22%), and Immigrants from Cameroon (5.0%, a difference of 0.23%).
| Demographics | Rating | Rank | Married-Couple Family Poverty |
| Immigrants from China | 84.6 /100 | #142 | Excellent 5.0% |
| Immigrants from Egypt | 83.4 /100 | #143 | Excellent 5.0% |
| Hmong | 83.2 /100 | #144 | Excellent 5.0% |
| Immigrants from Spain | 79.9 /100 | #145 | Good 5.0% |
| Mongolians | 79.8 /100 | #146 | Good 5.0% |
| Syrians | 78.7 /100 | #147 | Good 5.0% |
| Immigrants from Russia | 78.7 /100 | #148 | Good 5.0% |
| Immigrants from Oceania | 78.6 /100 | #149 | Good 5.0% |
| Brazilians | 78.3 /100 | #150 | Good 5.0% |
| Immigrants from Cameroon | 77.3 /100 | #151 | Good 5.0% |
| Albanians | 77.2 /100 | #152 | Good 5.0% |
| Immigrants from Kuwait | 76.3 /100 | #153 | Good 5.0% |
| Delaware | 73.7 /100 | #154 | Good 5.1% |
| Immigrants from Ethiopia | 72.4 /100 | #155 | Good 5.1% |
| Sri Lankans | 72.2 /100 | #156 | Good 5.1% |
Immigrants from Oceania Married-Couple Family Poverty Correlation Summary
| Measurement | Immigrants from Oceania Data | Married-Couple Family Poverty Data |
| Minimum | 0.10% | 1.0% |
| Maximum | 32.2% | 12.9% |
| Range | 32.1% | 11.9% |
| Mean | 7.3% | 6.0% |
| Median | 6.1% | 5.1% |
| Interquartile 25% (IQ1) | 3.1% | 4.2% |
| Interquartile 75% (IQ3) | 9.1% | 7.4% |
| Interquartile Range (IQR) | 6.0% | 3.2% |
| Standard Deviation (Sample) | 6.5% | 2.8% |
| Standard Deviation (Population) | 6.4% | 2.7% |
Correlation Details
| Immigrants from Oceania Percentile | Sample Size | Married-Couple Family Poverty |
[ 0.0% - 0.5% ] 0.10% | 279,890,767 | 5.0% |
[ 0.5% - 1.0% ] 0.60% | 13,781,664 | 4.8% |
[ 1.0% - 1.5% ] 1.06% | 4,647,217 | 4.0% |
[ 1.0% - 1.5% ] 1.49% | 2,186,315 | 4.9% |
[ 1.5% - 2.0% ] 1.97% | 784,782 | 4.2% |
[ 2.0% - 2.5% ] 2.42% | 494,971 | 6.3% |
[ 2.5% - 3.0% ] 2.84% | 628,579 | 5.6% |
[ 3.0% - 3.5% ] 3.36% | 174,325 | 4.5% |
[ 3.5% - 4.0% ] 3.65% | 255,958 | 8.3% |
[ 4.0% - 4.5% ] 4.16% | 79,540 | 4.2% |
[ 4.0% - 4.5% ] 4.49% | 75,772 | 5.1% |
[ 5.0% - 5.5% ] 5.17% | 208,666 | 7.3% |
[ 5.0% - 5.5% ] 5.43% | 42,267 | 7.1% |
[ 5.5% - 6.0% ] 5.86% | 3,296 | 10.2% |
[ 6.0% - 6.5% ] 6.34% | 5,237 | 4.1% |
[ 6.5% - 7.0% ] 6.93% | 3,740 | 12.3% |
[ 7.0% - 7.5% ] 7.12% | 62,971 | 7.5% |
[ 7.5% - 8.0% ] 7.82% | 15,342 | 7.1% |
[ 8.0% - 8.5% ] 8.06% | 6,299 | 2.5% |
[ 8.0% - 8.5% ] 8.45% | 5,221 | 12.9% |
[ 8.5% - 9.0% ] 8.97% | 624 | 1.0% |
[ 9.0% - 9.5% ] 9.31% | 290 | 7.8% |
[ 9.5% - 10.0% ] 9.71% | 896 | 5.4% |
[ 11.0% - 11.5% ] 11.17% | 1,674 | 9.0% |
[ 12.5% - 13.0% ] 12.94% | 7,236 | 4.4% |
[ 13.0% - 13.5% ] 13.36% | 5,411 | 2.8% |
[ 18.5% - 19.0% ] 18.76% | 693 | 4.9% |
[ 32.0% - 32.5% ] 32.16% | 398 | 3.7% |