Immigrants from Zaire Married-Couple Family Poverty

COMPARE

Immigrants from Zaire
Race
Ancestry
AfghanAfricanAlaska NativeAlaskan AthabascanAlbanianAleutAlsatianAmericanApacheArabArapahoArgentineanArmenianAssyrian/Chaldean/SyriacAustralianAustrianBahamianBangladeshiBarbadianBasqueBelgianBelizeanBermudanBhutaneseBlackfeetBolivianBrazilianBritishBritish West IndianBulgarianBurmeseCajunCambodianCanadianCape VerdeanCarpatho RusynCelticCentral AmericanCentral American IndianCherokeeCheyenneChickasawChileanChineseChippewaChoctawColombianColvilleComancheCosta RicanCreeCreekCroatianCrowCubanCypriotCzechCzechoslovakianDanishDelawareDominicanDutchDutch West IndianEastern EuropeanEcuadorianEgyptianEnglishEstonianEthiopianEuropeanFijianFilipinoFinnishFrenchFrench American IndianFrench CanadianGermanGerman RussianGhanaianGreekGuamanian/ChamorroGuatemalanGuyaneseHaitianHmongHonduranHopiHoumaHungarianIcelanderIndian (Asian)IndonesianInupiatIranianIraqiIrishIroquoisIsraeliItalianJamaicanJapaneseJordanianKenyanKiowaKoreanLaotianLatvianLebaneseLiberianLithuanianLumbeeLuxembourgerMacedonianMalaysianMalteseMarshalleseMenomineeMexicanMexican American IndianMongolianMoroccanNative HawaiianNavajoNepaleseNew ZealanderNicaraguanNigerianNorthern EuropeanNorwegianOkinawanOsageOttawaPaiutePakistaniPalestinianPanamanianParaguayanPennsylvania GermanPeruvianPimaPolishPortuguesePotawatomiPuebloPuerto RicanPuget Sound SalishRomanianRussianSalvadoranSamoanScandinavianScotch-IrishScottishSeminoleSenegaleseSerbianShoshoneSierra LeoneanSiouxSlavicSlovakSloveneSomaliSouth AfricanSouth AmericanSouth American IndianSoviet UnionSpaniardSpanishSpanish AmericanSpanish American IndianSri LankanSubsaharan AfricanSudaneseSwedishSwissSyrianTaiwaneseThaiTlingit-HaidaTohono O'OdhamTonganTrinidadian and TobagonianTsimshianTurkishU.S. Virgin IslanderUgandanUkrainianUruguayanUteVenezuelanVietnameseWelshWest IndianYakamaYaquiYugoslavianYumanYup'ikZimbabwean
Immigration
NonimmigrantsImmigrantsAfghanistanAfricaAlbaniaArgentinaArmeniaAsiaAustraliaAustriaBahamasBangladeshBarbadosBelarusBelgiumBelizeBoliviaBosnia and HerzegovinaBrazilBulgariaBurma/MyanmarCabo VerdeCambodiaCameroonCanadaCaribbeanCentral AmericaChileChinaColombiaCongoCosta RicaCroatiaCubaCzechoslovakiaDenmarkDominicaDominican RepublicEastern AfricaEastern AsiaEastern EuropeEcuadorEgyptEl SalvadorEnglandEritreaEthiopiaEuropeFijiFranceGermanyGhanaGreeceGrenadaGuatemalaGuyanaHaitiHondurasHong KongHungaryIndiaIndonesiaIranIraqIrelandIsraelItalyJamaicaJapanJordanKazakhstanKenyaKoreaKuwaitLaosLatin AmericaLatviaLebanonLiberiaLithuaniaMalaysiaMexicoMicronesiaMiddle AfricaMoldovaMoroccoNepalNetherlandsNicaraguaNigeriaNorth AmericaNorth MacedoniaNorthern AfricaNorthern EuropeNorwayOceaniaPakistanPanamaPeruPhilippinesPolandPortugalRomaniaRussiaSaudi ArabiaScotlandSenegalSerbiaSierra LeoneSingaporeSomaliaSouth AfricaSouth AmericaSouth Central AsiaSouth Eastern AsiaSouthern EuropeSpainSri LankaSt. Vincent and the GrenadinesSudanSwedenSwitzerlandSyriaTaiwanThailandTrinidad and TobagoTurkeyUgandaUkraineUruguayUzbekistanVenezuelaVietnamWest IndiesWestern AfricaWestern AsiaWestern EuropeYemenZaireZimbabweAzores
Select to Compare
Race
Ancestry
AfghanAfricanAlaska NativeAlaskan AthabascanAlbanianAleutAlsatianAmericanApacheArabArapahoArgentineanArmenianAssyrian/Chaldean/SyriacAustralianAustrianBahamianBangladeshiBarbadianBasqueBelgianBelizeanBermudanBhutaneseBlackfeetBolivianBrazilianBritishBritish West IndianBulgarianBurmeseCajunCambodianCanadianCape VerdeanCarpatho RusynCelticCentral AmericanCentral American IndianCherokeeCheyenneChickasawChileanChineseChippewaChoctawColombianColvilleComancheCosta RicanCreeCreekCroatianCrowCubanCypriotCzechCzechoslovakianDanishDelawareDominicanDutchDutch West IndianEastern EuropeanEcuadorianEgyptianEnglishEstonianEthiopianEuropeanFijianFilipinoFinnishFrenchFrench American IndianFrench CanadianGermanGerman RussianGhanaianGreekGuamanian/ChamorroGuatemalanGuyaneseHaitianHmongHonduranHopiHoumaHungarianIcelanderIndian (Asian)IndonesianInupiatIranianIraqiIrishIroquoisIsraeliItalianJamaicanJapaneseJordanianKenyanKiowaKoreanLaotianLatvianLebaneseLiberianLithuanianLumbeeLuxembourgerMacedonianMalaysianMalteseMarshalleseMenomineeMexicanMexican American IndianMongolianMoroccanNative HawaiianNavajoNepaleseNew ZealanderNicaraguanNigerianNorthern EuropeanNorwegianOkinawanOsageOttawaPaiutePakistaniPalestinianPanamanianParaguayanPennsylvania GermanPeruvianPimaPolishPortuguesePotawatomiPuebloPuerto RicanPuget Sound SalishRomanianRussianSalvadoranSamoanScandinavianScotch-IrishScottishSeminoleSenegaleseSerbianShoshoneSierra LeoneanSiouxSlavicSlovakSloveneSomaliSouth AfricanSouth AmericanSouth American IndianSoviet UnionSpaniardSpanishSpanish AmericanSpanish American IndianSri LankanSubsaharan AfricanSudaneseSwedishSwissSyrianTaiwaneseThaiTlingit-HaidaTohono O'OdhamTonganTrinidadian and TobagonianTsimshianTurkishU.S. Virgin IslanderUgandanUkrainianUruguayanUteVenezuelanVietnameseWelshWest IndianYakamaYaquiYugoslavianYumanYup'ikZimbabwean
Immigration
NonimmigrantsImmigrantsAfghanistanAfricaAlbaniaArgentinaArmeniaAsiaAustraliaAustriaBahamasBangladeshBarbadosBelarusBelgiumBelizeBoliviaBosnia and HerzegovinaBrazilBulgariaBurma/MyanmarCabo VerdeCambodiaCameroonCanadaCaribbeanCentral AmericaChileChinaColombiaCongoCosta RicaCroatiaCubaCzechoslovakiaDenmarkDominicaDominican RepublicEastern AfricaEastern AsiaEastern EuropeEcuadorEgyptEl SalvadorEnglandEritreaEthiopiaEuropeFijiFranceGermanyGhanaGreeceGrenadaGuatemalaGuyanaHaitiHondurasHong KongHungaryIndiaIndonesiaIranIraqIrelandIsraelItalyJamaicaJapanJordanKazakhstanKenyaKoreaKuwaitLaosLatin AmericaLatviaLebanonLiberiaLithuaniaMalaysiaMexicoMicronesiaMiddle AfricaMoldovaMoroccoNepalNetherlandsNicaraguaNigeriaNorth AmericaNorth MacedoniaNorthern AfricaNorthern EuropeNorwayOceaniaPakistanPanamaPeruPhilippinesPolandPortugalRomaniaRussiaSaudi ArabiaScotlandSenegalSerbiaSierra LeoneSingaporeSomaliaSouth AfricaSouth AmericaSouth Central AsiaSouth Eastern AsiaSouthern EuropeSpainSri LankaSt. Vincent and the GrenadinesSudanSwedenSwitzerlandSyriaTaiwanThailandTrinidad and TobagoTurkeyUgandaUkraineUruguayUzbekistanVenezuelaVietnamWest IndiesWestern AfricaWestern AsiaWestern EuropeYemenZimbabweAzores
Married-Couple Family Poverty
Income
Poverty
Unemployment
Labor Participation
Family Structure
Vehicle Availability
Education Level
Disability

Immigrants from Zaire Married-Couple Family Poverty
Tragic

5.6%
POVERTY | MARRIED-COUPLE FAMILIES
5.6/ 100
METRIC RATING
227th/ 347
METRIC RANK

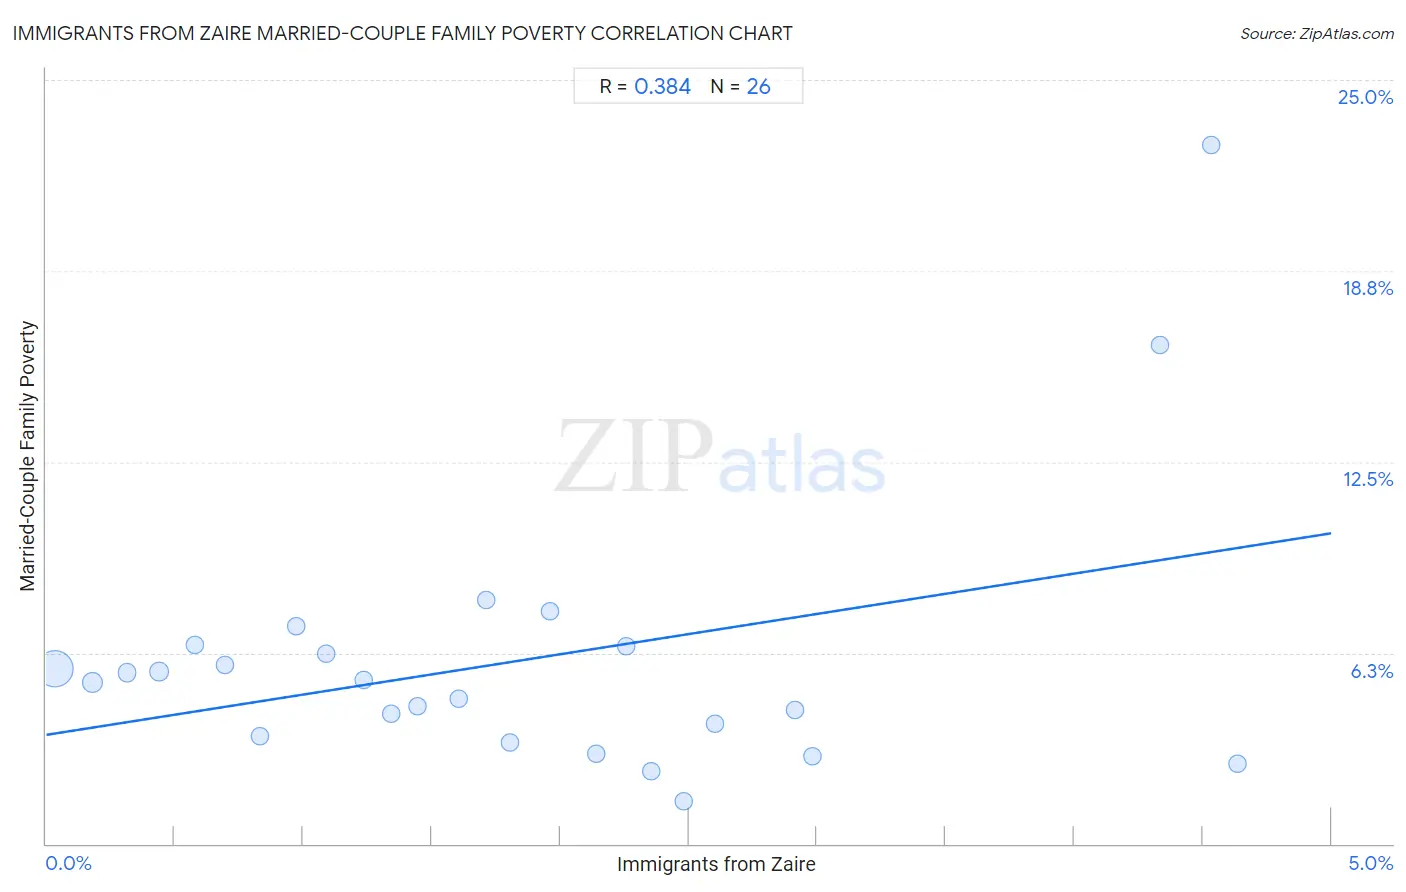
Immigrants from Zaire Married-Couple Family Poverty Correlation Chart

The statistical analysis conducted on geographies consisting of 106,970,215 people shows a mild positive correlation between the proportion of Immigrants from Zaire and poverty level among married-couple families in the United States with a correlation coefficient (R) of 0.384 and weighted average of 5.6%. On average, for every 1% (one percent) increase in Immigrants from Zaire within a typical geography, there is an increase of 1.3% in poverty level among married-couple families.
Immigrants from Zaire Married-Couple Family Poverty
It is essential to understand that the correlation between the percentage of Immigrants from Zaire and poverty level among married-couple families does not imply a direct cause-and-effect relationship. It remains uncertain whether the presence of Immigrants from Zaire influences an upward or downward trend in the level of poverty level among married-couple families within an area, or if Immigrants from Zaire simply ended up residing in those areas with higher or lower levels of poverty level among married-couple families due to other factors.

Demographics Similar to Immigrants from Zaire by Married-Couple Family Poverty

In terms of married-couple family poverty, the demographic groups most similar to Immigrants from Zaire are South American (5.6%, a difference of 0.020%), Arab (5.7%, a difference of 0.13%), Immigrants from Cambodia (5.6%, a difference of 0.24%), Sudanese (5.6%, a difference of 0.38%), and Subsaharan African (5.7%, a difference of 0.38%).
DemographicsRating | RankMarried-Couple Family Poverty
Colombians
9.2
/100
|
#220
Tragic
5.6%
Panamanians
9.2
/100
|
#221
Tragic
5.6%
Cajuns
6.9
/100
|
#222
Tragic
5.6%
Immigrants from Fiji
6.7
/100
|
#223
Tragic
5.6%
Sudanese
6.4
/100
|
#224
Tragic
5.6%
Immigrants from Cambodia
6.1
/100
|
#225
Tragic
5.6%
South Americans
5.7
/100
|
#226
Tragic
5.6%
Immigrants from Zaire
5.6
/100
|
#227
Tragic
5.6%
Arabs
5.4
/100
|
#228
Tragic
5.7%
Sub-Saharan Africans
4.9
/100
|
#229
Tragic
5.7%
Moroccans
4.9
/100
|
#230
Tragic
5.7%
Immigrants from Iraq
4.4
/100
|
#231
Tragic
5.7%
Immigrants from Laos
4.4
/100
|
#232
Tragic
5.7%
Immigrants from Colombia
3.7
/100
|
#233
Tragic
5.7%
Immigrants from Uruguay
3.7
/100
|
#234
Tragic
5.7%

Immigrants from Zaire Married-Couple Family Poverty Correlation Summary

MeasurementImmigrants from Zaire DataMarried-Couple Family Poverty Data
Minimum0.034%1.4%
Maximum4.6%22.9%
Range4.6%21.5%
Mean1.8%6.0%
Median1.7%5.3%
Interquartile 25% (IQ1)0.83%3.5%
Interquartile 75% (IQ3)2.5%6.5%
Interquartile Range (IQR)1.6%3.0%
Standard Deviation (Sample)1.3%4.4%
Standard Deviation (Population)1.3%4.4%

Correlation Details

Immigrants from Zaire PercentileSample SizeMarried-Couple Family Poverty
[
0.0%
-
0.5%
]
0.034%
85,904,2245.7%
[
0.0%
-
0.5%
]
0.18%
11,509,1885.3%
[
0.0%
-
0.5%
]
0.31%
3,920,4725.6%
[
0.0%
-
0.5%
]
0.44%
2,339,3055.6%
[
0.5%
-
1.0%
]
0.58%
911,5416.5%
[
0.5%
-
1.0%
]
0.69%
428,5985.8%
[
0.5%
-
1.0%
]
0.83%
449,2973.5%
[
0.5%
-
1.0%
]
0.97%
319,5097.1%
[
1.0%
-
1.5%
]
1.09%
351,5806.2%
[
1.0%
-
1.5%
]
1.24%
182,5925.4%
[
1.0%
-
1.5%
]
1.34%
151,8904.3%
[
1.0%
-
1.5%
]
1.44%
48,3554.5%
[
1.5%
-
2.0%
]
1.61%
91,4934.7%
[
1.5%
-
2.0%
]
1.71%
3,7338.0%
[
1.5%
-
2.0%
]
1.81%
22,8603.3%
[
1.5%
-
2.0%
]
1.96%
60,4557.6%
[
2.0%
-
2.5%
]
2.14%
37,9262.9%
[
2.0%
-
2.5%
]
2.26%
23,4286.5%
[
2.0%
-
2.5%
]
2.36%
36,3902.4%
[
2.0%
-
2.5%
]
2.48%
63,3941.4%
[
2.5%
-
3.0%
]
2.60%
10,5363.9%
[
2.5%
-
3.0%
]
2.92%
66,5074.4%
[
2.5%
-
3.0%
]
2.98%
8,6812.9%
[
4.0%
-
4.5%
]
4.34%
36916.3%
[
4.5%
-
5.0%
]
4.53%
26,68422.9%
[
4.5%
-
5.0%
]
4.64%
1,2082.6%