Immigrants from Peru Married-Couple Family Poverty
COMPARE
Immigrants from Peru
Select to Compare
Married-Couple Family Poverty
Immigrants from Peru Married-Couple Family Poverty
5.4%
POVERTY | MARRIED-COUPLE FAMILIES
21.8/ 100
METRIC RATING
203rd/ 347
METRIC RANK
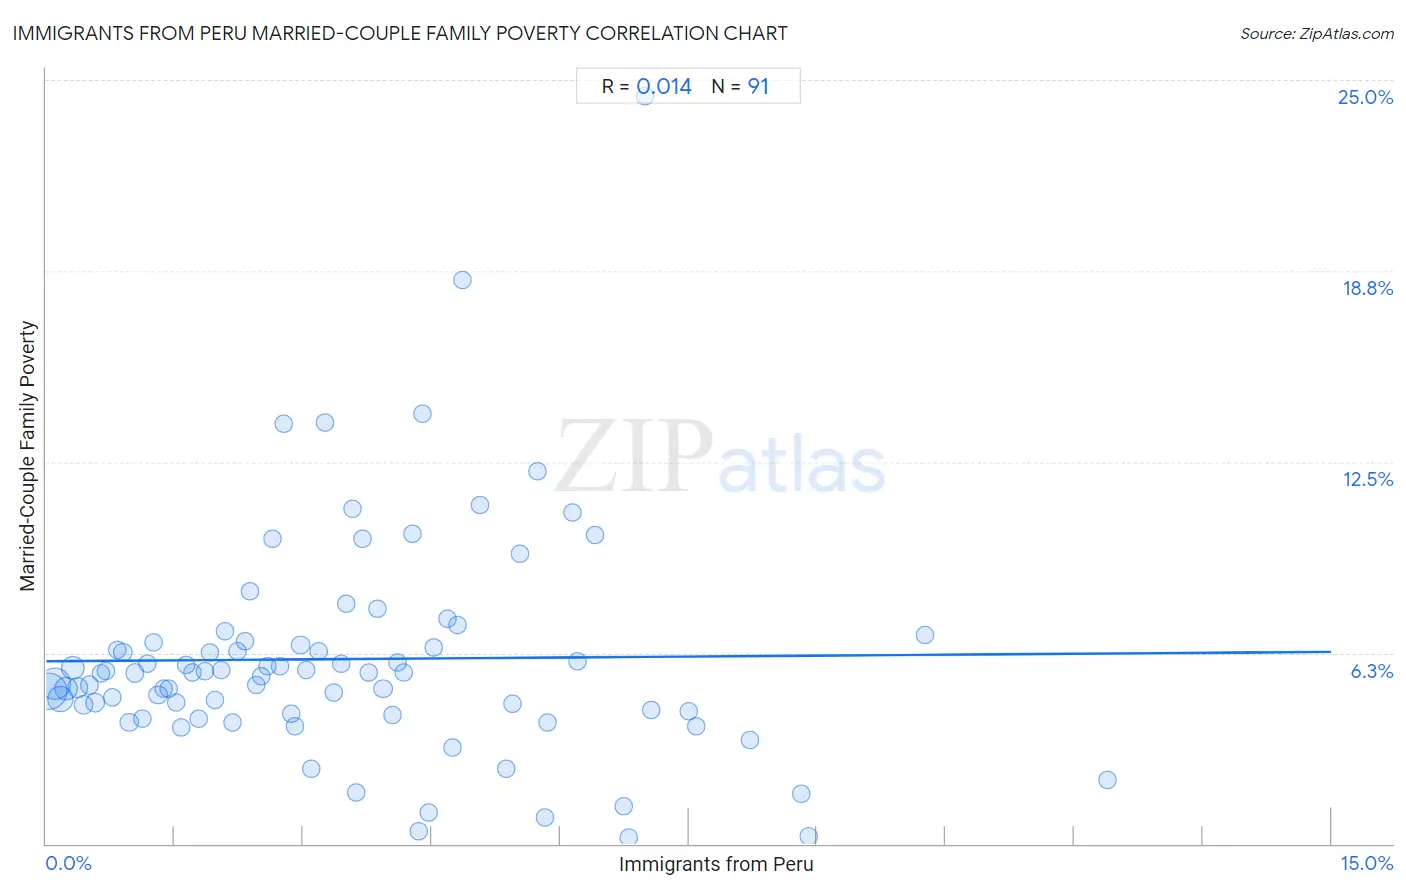
Immigrants from Peru Married-Couple Family Poverty Correlation Chart
The statistical analysis conducted on geographies consisting of 326,893,317 people shows no correlation between the proportion of Immigrants from Peru and poverty level among married-couple families in the United States with a correlation coefficient (R) of 0.014 and weighted average of 5.4%. On average, for every 1% (one percent) increase in Immigrants from Peru within a typical geography, there is an increase of 0.020% in poverty level among married-couple families.
It is essential to understand that the correlation between the percentage of Immigrants from Peru and poverty level among married-couple families does not imply a direct cause-and-effect relationship. It remains uncertain whether the presence of Immigrants from Peru influences an upward or downward trend in the level of poverty level among married-couple families within an area, or if Immigrants from Peru simply ended up residing in those areas with higher or lower levels of poverty level among married-couple families due to other factors.
Demographics Similar to Immigrants from Peru by Married-Couple Family Poverty
In terms of married-couple family poverty, the demographic groups most similar to Immigrants from Peru are Immigrants from Middle Africa (5.4%, a difference of 0.32%), Lebanese (5.4%, a difference of 0.38%), Immigrants from Morocco (5.4%, a difference of 0.40%), Immigrants from Costa Rica (5.4%, a difference of 0.41%), and Chippewa (5.4%, a difference of 0.49%).
| Demographics | Rating | Rank | Married-Couple Family Poverty |
| Spaniards | 27.4 /100 | #196 | Fair 5.4% |
| Liberians | 26.3 /100 | #197 | Fair 5.4% |
| Immigrants from Belarus | 26.2 /100 | #198 | Fair 5.4% |
| Uruguayans | 25.0 /100 | #199 | Fair 5.4% |
| Immigrants from Morocco | 24.3 /100 | #200 | Fair 5.4% |
| Lebanese | 24.1 /100 | #201 | Fair 5.4% |
| Immigrants from Middle Africa | 23.8 /100 | #202 | Fair 5.4% |
| Immigrants from Peru | 21.8 /100 | #203 | Fair 5.4% |
| Immigrants from Costa Rica | 19.4 /100 | #204 | Poor 5.4% |
| Chippewa | 18.9 /100 | #205 | Poor 5.4% |
| Osage | 18.4 /100 | #206 | Poor 5.4% |
| Immigrants from Africa | 17.6 /100 | #207 | Poor 5.5% |
| French American Indians | 16.1 /100 | #208 | Poor 5.5% |
| Immigrants from Syria | 15.4 /100 | #209 | Poor 5.5% |
| Immigrants from Micronesia | 14.4 /100 | #210 | Poor 5.5% |
Immigrants from Peru Married-Couple Family Poverty Correlation Summary
| Measurement | Immigrants from Peru Data | Married-Couple Family Poverty Data |
| Minimum | 0.036% | 0.19% |
| Maximum | 12.4% | 24.5% |
| Range | 12.4% | 24.3% |
| Mean | 3.5% | 6.0% |
| Median | 3.0% | 5.6% |
| Interquartile 25% (IQ1) | 1.5% | 4.2% |
| Interquartile 75% (IQ3) | 4.8% | 6.6% |
| Interquartile Range (IQR) | 3.3% | 2.3% |
| Standard Deviation (Sample) | 2.5% | 3.7% |
| Standard Deviation (Population) | 2.5% | 3.7% |
Correlation Details
| Immigrants from Peru Percentile | Sample Size | Married-Couple Family Poverty |
[ 0.0% - 0.5% ] 0.036% | 101,450,187 | 5.0% |
[ 0.0% - 0.5% ] 0.097% | 74,872,066 | 5.2% |
[ 0.0% - 0.5% ] 0.17% | 37,105,456 | 4.7% |
[ 0.0% - 0.5% ] 0.23% | 28,414,199 | 5.1% |
[ 0.0% - 0.5% ] 0.31% | 23,731,066 | 5.8% |
[ 0.0% - 0.5% ] 0.37% | 11,490,116 | 5.1% |
[ 0.0% - 0.5% ] 0.44% | 8,694,917 | 4.5% |
[ 0.5% - 1.0% ] 0.50% | 6,118,856 | 5.2% |
[ 0.5% - 1.0% ] 0.57% | 5,249,487 | 4.6% |
[ 0.5% - 1.0% ] 0.64% | 3,594,451 | 5.6% |
[ 0.5% - 1.0% ] 0.70% | 2,974,448 | 5.7% |
[ 0.5% - 1.0% ] 0.77% | 1,765,352 | 4.8% |
[ 0.5% - 1.0% ] 0.83% | 1,680,908 | 6.4% |
[ 0.5% - 1.0% ] 0.90% | 2,504,549 | 6.3% |
[ 0.5% - 1.0% ] 0.97% | 1,445,863 | 4.0% |
[ 1.0% - 1.5% ] 1.04% | 1,201,012 | 5.6% |
[ 1.0% - 1.5% ] 1.12% | 1,031,217 | 4.1% |
[ 1.0% - 1.5% ] 1.18% | 1,183,634 | 5.9% |
[ 1.0% - 1.5% ] 1.25% | 1,238,549 | 6.6% |
[ 1.0% - 1.5% ] 1.31% | 645,352 | 4.9% |
[ 1.0% - 1.5% ] 1.37% | 1,362,730 | 5.1% |
[ 1.0% - 1.5% ] 1.44% | 598,276 | 5.1% |
[ 1.5% - 2.0% ] 1.51% | 647,594 | 4.6% |
[ 1.5% - 2.0% ] 1.58% | 615,154 | 3.8% |
[ 1.5% - 2.0% ] 1.64% | 552,143 | 5.9% |
[ 1.5% - 2.0% ] 1.71% | 491,289 | 5.6% |
[ 1.5% - 2.0% ] 1.78% | 504,327 | 4.1% |
[ 1.5% - 2.0% ] 1.85% | 613,266 | 5.7% |
[ 1.5% - 2.0% ] 1.91% | 459,745 | 6.3% |
[ 1.5% - 2.0% ] 1.97% | 305,141 | 4.7% |
[ 2.0% - 2.5% ] 2.04% | 239,145 | 5.7% |
[ 2.0% - 2.5% ] 2.08% | 258,051 | 7.0% |
[ 2.0% - 2.5% ] 2.18% | 351,081 | 4.0% |
[ 2.0% - 2.5% ] 2.24% | 415,010 | 6.3% |
[ 2.0% - 2.5% ] 2.32% | 199,479 | 6.6% |
[ 2.0% - 2.5% ] 2.38% | 192,219 | 8.3% |
[ 2.0% - 2.5% ] 2.45% | 66,045 | 5.2% |
[ 2.5% - 3.0% ] 2.51% | 196,329 | 5.5% |
[ 2.5% - 3.0% ] 2.58% | 33,382 | 5.8% |
[ 2.5% - 3.0% ] 2.64% | 226,495 | 10.0% |
[ 2.5% - 3.0% ] 2.73% | 296,287 | 5.8% |
[ 2.5% - 3.0% ] 2.77% | 14,182 | 13.7% |
[ 2.5% - 3.0% ] 2.86% | 66,752 | 4.2% |
[ 2.5% - 3.0% ] 2.91% | 92,317 | 3.9% |
[ 2.5% - 3.0% ] 2.97% | 239,202 | 6.5% |
[ 3.0% - 3.5% ] 3.04% | 155,207 | 5.7% |
[ 3.0% - 3.5% ] 3.09% | 5,335 | 2.4% |
[ 3.0% - 3.5% ] 3.18% | 125,467 | 6.3% |
[ 3.0% - 3.5% ] 3.25% | 40,750 | 13.8% |
[ 3.0% - 3.5% ] 3.36% | 19,482 | 4.9% |
[ 3.0% - 3.5% ] 3.44% | 88,575 | 5.9% |
[ 3.5% - 4.0% ] 3.50% | 12,071 | 7.9% |
[ 3.5% - 4.0% ] 3.58% | 26,077 | 11.0% |
[ 3.5% - 4.0% ] 3.62% | 856 | 1.7% |
[ 3.5% - 4.0% ] 3.69% | 217 | 10.0% |
[ 3.5% - 4.0% ] 3.77% | 41,139 | 5.6% |
[ 3.5% - 4.0% ] 3.86% | 14,570 | 7.7% |
[ 3.5% - 4.0% ] 3.93% | 174,684 | 5.1% |
[ 4.0% - 4.5% ] 4.04% | 1,534 | 4.2% |
[ 4.0% - 4.5% ] 4.10% | 38,759 | 5.9% |
[ 4.0% - 4.5% ] 4.18% | 16,429 | 5.6% |
[ 4.0% - 4.5% ] 4.27% | 202,257 | 10.2% |
[ 4.0% - 4.5% ] 4.34% | 2,302 | 0.41% |
[ 4.0% - 4.5% ] 4.40% | 15,139 | 14.1% |
[ 4.0% - 4.5% ] 4.46% | 38,163 | 1.0% |
[ 4.5% - 5.0% ] 4.53% | 16,596 | 6.4% |
[ 4.5% - 5.0% ] 4.69% | 43,269 | 7.4% |
[ 4.5% - 5.0% ] 4.74% | 33,691 | 3.1% |
[ 4.5% - 5.0% ] 4.81% | 37,169 | 7.2% |
[ 4.5% - 5.0% ] 4.86% | 7,598 | 18.5% |
[ 5.0% - 5.5% ] 5.07% | 25,988 | 11.1% |
[ 5.0% - 5.5% ] 5.37% | 1,359 | 2.5% |
[ 5.0% - 5.5% ] 5.44% | 7,185 | 4.6% |
[ 5.5% - 6.0% ] 5.52% | 62,419 | 9.5% |
[ 5.5% - 6.0% ] 5.73% | 19,625 | 12.2% |
[ 5.5% - 6.0% ] 5.82% | 8,104 | 0.87% |
[ 5.5% - 6.0% ] 5.85% | 6,601 | 4.0% |
[ 6.0% - 6.5% ] 6.14% | 2,718 | 10.8% |
[ 6.0% - 6.5% ] 6.20% | 43,671 | 6.0% |
[ 6.0% - 6.5% ] 6.41% | 1,497 | 10.1% |
[ 6.5% - 7.0% ] 6.74% | 11,584 | 1.2% |
[ 6.5% - 7.0% ] 6.79% | 2,753 | 0.19% |
[ 6.5% - 7.0% ] 6.99% | 8,373 | 24.5% |
[ 7.0% - 7.5% ] 7.06% | 82,314 | 4.4% |
[ 7.5% - 8.0% ] 7.50% | 2,533 | 4.3% |
[ 7.5% - 8.0% ] 7.58% | 963 | 3.9% |
[ 8.0% - 8.5% ] 8.22% | 11,069 | 3.4% |
[ 8.5% - 9.0% ] 8.81% | 4,947 | 1.7% |
[ 8.5% - 9.0% ] 8.90% | 2,101 | 0.26% |
[ 10.0% - 10.5% ] 10.26% | 1,277 | 6.8% |
[ 12.0% - 12.5% ] 12.39% | 1,574 | 2.1% |