Immigrants from Philippines Married-Couple Family Poverty
COMPARE
Immigrants from Philippines
Select to Compare
Married-Couple Family Poverty
Immigrants from Philippines Married-Couple Family Poverty
4.8%
POVERTY | MARRIED-COUPLE FAMILIES
94.6/ 100
METRIC RATING
118th/ 347
METRIC RANK
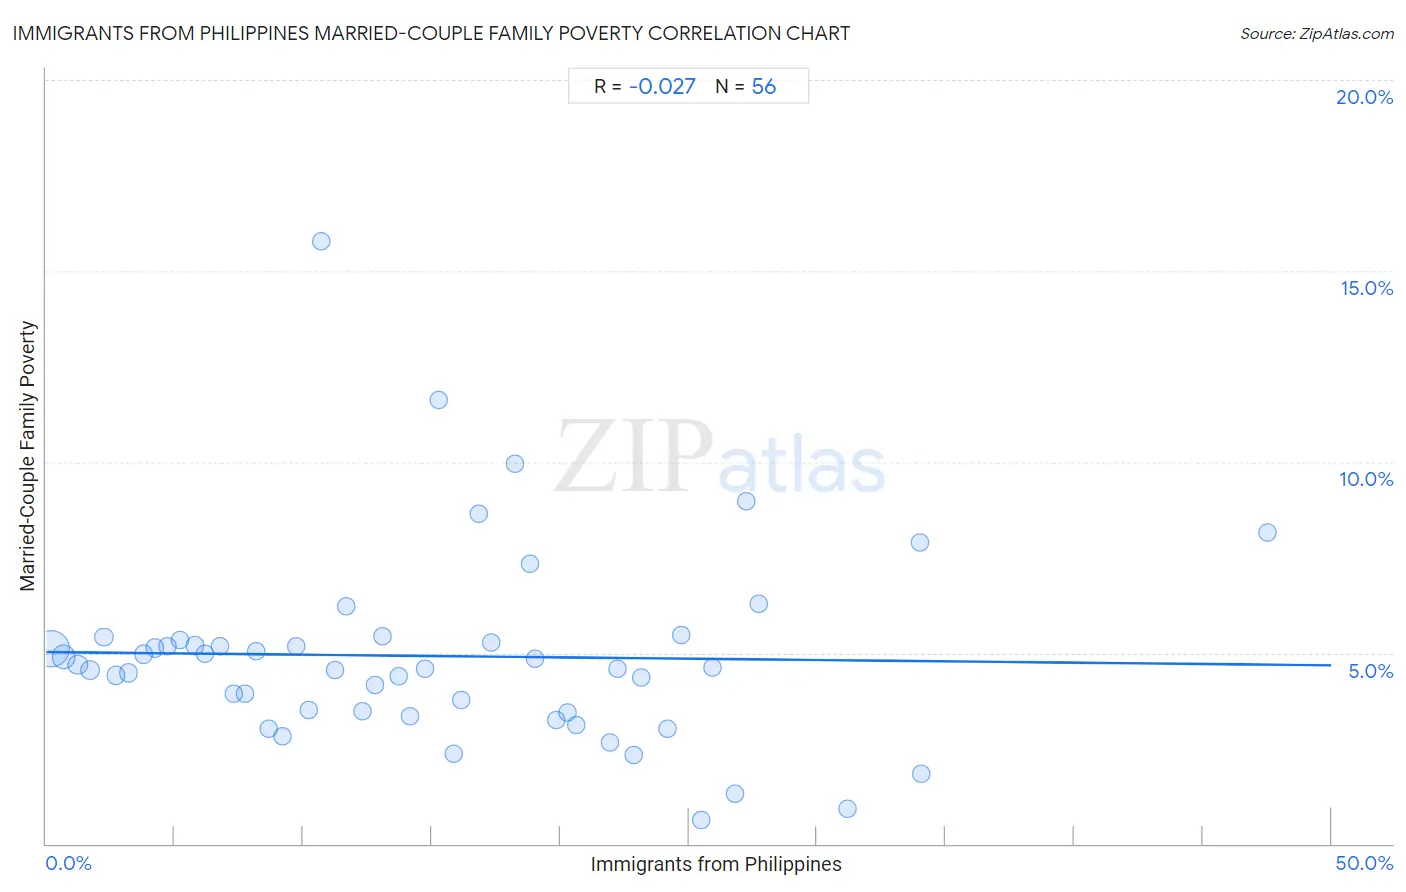
Immigrants from Philippines Married-Couple Family Poverty Correlation Chart
The statistical analysis conducted on geographies consisting of 465,939,679 people shows no correlation between the proportion of Immigrants from Philippines and poverty level among married-couple families in the United States with a correlation coefficient (R) of -0.027 and weighted average of 4.8%. On average, for every 1% (one percent) increase in Immigrants from Philippines within a typical geography, there is a decrease of 0.0070% in poverty level among married-couple families.
It is essential to understand that the correlation between the percentage of Immigrants from Philippines and poverty level among married-couple families does not imply a direct cause-and-effect relationship. It remains uncertain whether the presence of Immigrants from Philippines influences an upward or downward trend in the level of poverty level among married-couple families within an area, or if Immigrants from Philippines simply ended up residing in those areas with higher or lower levels of poverty level among married-couple families due to other factors.
Demographics Similar to Immigrants from Philippines by Married-Couple Family Poverty
In terms of married-couple family poverty, the demographic groups most similar to Immigrants from Philippines are Kenyan (4.8%, a difference of 0.020%), Celtic (4.8%, a difference of 0.12%), Taiwanese (4.8%, a difference of 0.13%), Immigrants from Indonesia (4.8%, a difference of 0.28%), and Immigrants from Eastern Asia (4.8%, a difference of 0.37%).
| Demographics | Rating | Rank | Married-Couple Family Poverty |
| Pakistanis | 96.2 /100 | #111 | Exceptional 4.7% |
| Tongans | 95.9 /100 | #112 | Exceptional 4.7% |
| Immigrants from Nepal | 95.9 /100 | #113 | Exceptional 4.7% |
| Immigrants from Indonesia | 95.1 /100 | #114 | Exceptional 4.8% |
| Taiwanese | 94.8 /100 | #115 | Exceptional 4.8% |
| Celtics | 94.8 /100 | #116 | Exceptional 4.8% |
| Kenyans | 94.7 /100 | #117 | Exceptional 4.8% |
| Immigrants from Philippines | 94.6 /100 | #118 | Exceptional 4.8% |
| Immigrants from Eastern Asia | 94.0 /100 | #119 | Exceptional 4.8% |
| Immigrants from Southern Europe | 93.4 /100 | #120 | Exceptional 4.8% |
| Indians (Asian) | 93.2 /100 | #121 | Exceptional 4.8% |
| Whites/Caucasians | 93.1 /100 | #122 | Exceptional 4.8% |
| Jordanians | 93.1 /100 | #123 | Exceptional 4.8% |
| Romanians | 92.5 /100 | #124 | Exceptional 4.8% |
| Immigrants from Bosnia and Herzegovina | 92.5 /100 | #125 | Exceptional 4.8% |
Immigrants from Philippines Married-Couple Family Poverty Correlation Summary
| Measurement | Immigrants from Philippines Data | Married-Couple Family Poverty Data |
| Minimum | 0.21% | 0.63% |
| Maximum | 47.5% | 15.8% |
| Range | 47.3% | 15.2% |
| Mean | 15.0% | 4.9% |
| Median | 13.9% | 4.6% |
| Interquartile 25% (IQ1) | 7.0% | 3.5% |
| Interquartile 75% (IQ3) | 22.1% | 5.3% |
| Interquartile Range (IQR) | 15.1% | 1.8% |
| Standard Deviation (Sample) | 10.0% | 2.5% |
| Standard Deviation (Population) | 9.9% | 2.5% |
Correlation Details
| Immigrants from Philippines Percentile | Sample Size | Married-Couple Family Poverty |
[ 0.0% - 0.5% ] 0.21% | 293,701,099 | 5.1% |
[ 0.5% - 1.0% ] 0.70% | 79,837,250 | 4.9% |
[ 1.0% - 1.5% ] 1.23% | 28,351,986 | 4.7% |
[ 1.5% - 2.0% ] 1.72% | 16,935,024 | 4.6% |
[ 2.0% - 2.5% ] 2.23% | 13,435,515 | 5.4% |
[ 2.5% - 3.0% ] 2.71% | 8,627,808 | 4.4% |
[ 3.0% - 3.5% ] 3.21% | 8,034,423 | 4.5% |
[ 3.5% - 4.0% ] 3.78% | 3,487,241 | 5.0% |
[ 4.0% - 4.5% ] 4.24% | 3,097,696 | 5.1% |
[ 4.5% - 5.0% ] 4.71% | 1,727,734 | 5.2% |
[ 5.0% - 5.5% ] 5.20% | 709,253 | 5.3% |
[ 5.5% - 6.0% ] 5.77% | 1,373,699 | 5.2% |
[ 6.0% - 6.5% ] 6.20% | 982,920 | 5.0% |
[ 6.5% - 7.0% ] 6.76% | 772,614 | 5.2% |
[ 7.0% - 7.5% ] 7.28% | 521,708 | 3.9% |
[ 7.5% - 8.0% ] 7.72% | 860,175 | 3.9% |
[ 8.0% - 8.5% ] 8.17% | 732,356 | 5.0% |
[ 8.5% - 9.0% ] 8.66% | 243,737 | 3.0% |
[ 9.0% - 9.5% ] 9.21% | 274,153 | 2.8% |
[ 9.5% - 10.0% ] 9.72% | 4,805 | 5.2% |
[ 10.0% - 10.5% ] 10.22% | 153,275 | 3.5% |
[ 10.5% - 11.0% ] 10.68% | 1,666 | 15.8% |
[ 11.0% - 11.5% ] 11.23% | 98,961 | 4.6% |
[ 11.5% - 12.0% ] 11.66% | 265,513 | 6.2% |
[ 12.0% - 12.5% ] 12.28% | 421,339 | 3.5% |
[ 12.5% - 13.0% ] 12.79% | 116,900 | 4.2% |
[ 13.0% - 13.5% ] 13.11% | 22,346 | 5.4% |
[ 13.5% - 14.0% ] 13.71% | 182,553 | 4.4% |
[ 14.0% - 14.5% ] 14.15% | 152,755 | 3.3% |
[ 14.5% - 15.0% ] 14.73% | 52,163 | 4.6% |
[ 15.0% - 15.5% ] 15.25% | 1,462 | 11.6% |
[ 15.5% - 16.0% ] 15.88% | 48,452 | 2.3% |
[ 16.0% - 16.5% ] 16.13% | 130,052 | 3.7% |
[ 16.5% - 17.0% ] 16.82% | 220 | 8.6% |
[ 17.0% - 17.5% ] 17.33% | 150 | 5.3% |
[ 18.0% - 18.5% ] 18.22% | 4,628 | 10.0% |
[ 18.5% - 19.0% ] 18.84% | 12,906 | 7.3% |
[ 19.0% - 19.5% ] 19.04% | 1,376 | 4.9% |
[ 19.5% - 20.0% ] 19.86% | 65,125 | 3.2% |
[ 20.0% - 20.5% ] 20.28% | 208,714 | 3.4% |
[ 20.5% - 21.0% ] 20.61% | 6,531 | 3.1% |
[ 21.5% - 22.0% ] 21.94% | 20,127 | 2.6% |
[ 22.0% - 22.5% ] 22.22% | 2,255 | 4.6% |
[ 22.5% - 23.0% ] 22.87% | 3,218 | 2.3% |
[ 23.0% - 23.5% ] 23.16% | 3,800 | 4.3% |
[ 24.0% - 24.5% ] 24.18% | 28,593 | 3.0% |
[ 24.5% - 25.0% ] 24.71% | 52,328 | 5.5% |
[ 25.0% - 25.5% ] 25.49% | 25,902 | 0.63% |
[ 25.5% - 26.0% ] 25.90% | 72,605 | 4.6% |
[ 26.5% - 27.0% ] 26.79% | 922 | 1.3% |
[ 27.0% - 27.5% ] 27.25% | 15,167 | 9.0% |
[ 27.5% - 28.0% ] 27.75% | 7,922 | 6.3% |
[ 31.0% - 31.5% ] 31.18% | 3,576 | 0.90% |
[ 33.5% - 34.0% ] 33.99% | 39,873 | 7.9% |
[ 34.0% - 34.5% ] 34.06% | 4,342 | 1.8% |
[ 47.5% - 48.0% ] 47.52% | 766 | 8.2% |