Immigrants from Eastern Asia Married-Couple Family Poverty
COMPARE
Immigrants from Eastern Asia
Select to Compare
Married-Couple Family Poverty
Immigrants from Eastern Asia Married-Couple Family Poverty
4.8%
POVERTY | MARRIED-COUPLE FAMILIES
94.0/ 100
METRIC RATING
119th/ 347
METRIC RANK
Immigrants from Eastern Asia Married-Couple Family Poverty Correlation Chart
The statistical analysis conducted on geographies consisting of 492,141,464 people shows a substantial positive correlation between the proportion of Immigrants from Eastern Asia and poverty level among married-couple families in the United States with a correlation coefficient (R) of 0.513 and weighted average of 4.8%. On average, for every 1% (one percent) increase in Immigrants from Eastern Asia within a typical geography, there is an increase of 0.17% in poverty level among married-couple families.
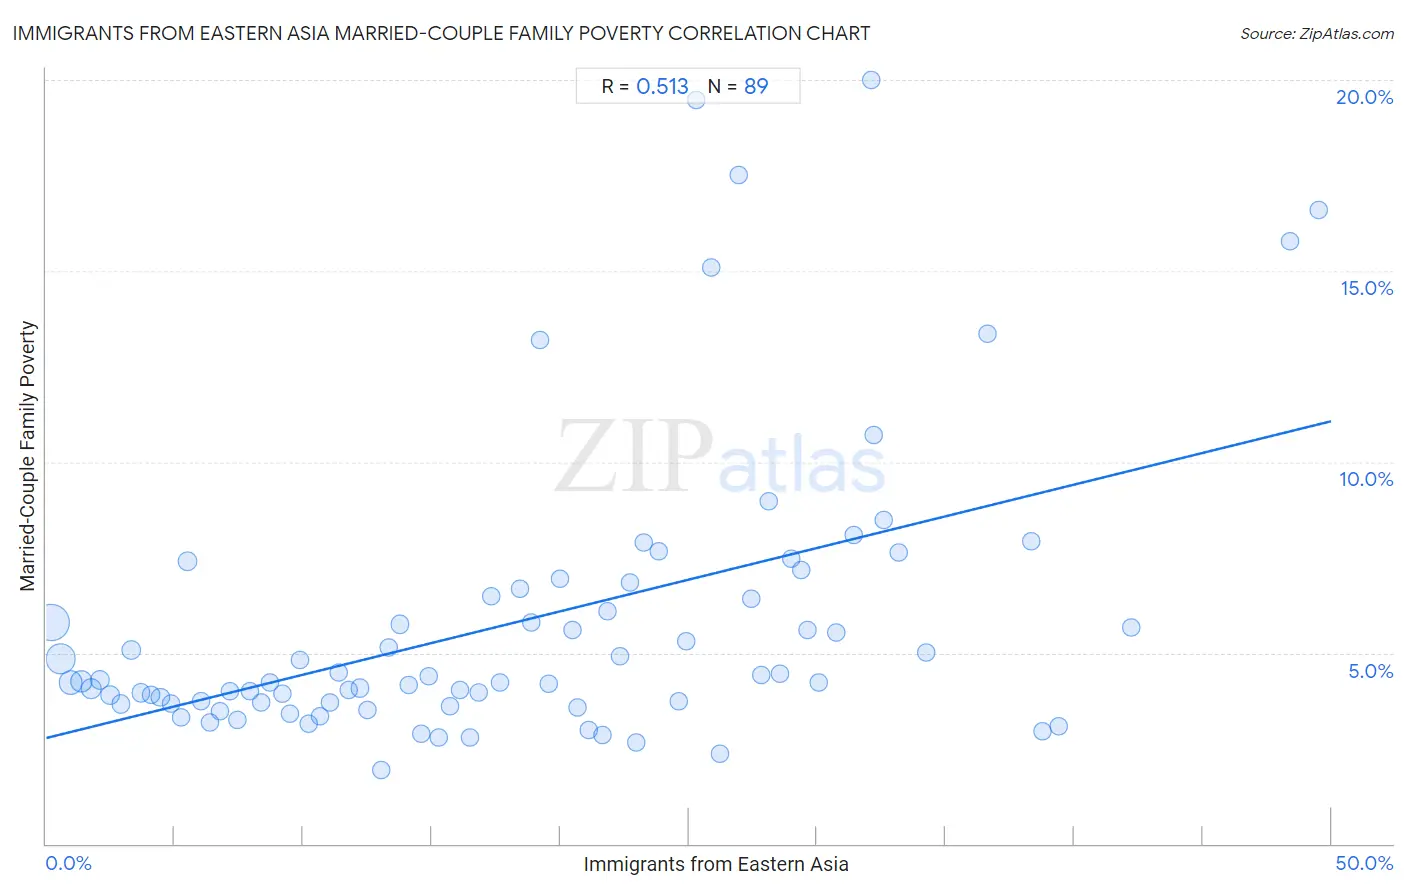
It is essential to understand that the correlation between the percentage of Immigrants from Eastern Asia and poverty level among married-couple families does not imply a direct cause-and-effect relationship. It remains uncertain whether the presence of Immigrants from Eastern Asia influences an upward or downward trend in the level of poverty level among married-couple families within an area, or if Immigrants from Eastern Asia simply ended up residing in those areas with higher or lower levels of poverty level among married-couple families due to other factors.
Demographics Similar to Immigrants from Eastern Asia by Married-Couple Family Poverty
In terms of married-couple family poverty, the demographic groups most similar to Immigrants from Eastern Asia are Immigrants from Southern Europe (4.8%, a difference of 0.32%), Immigrants from Philippines (4.8%, a difference of 0.37%), Kenyan (4.8%, a difference of 0.39%), Indian (Asian) (4.8%, a difference of 0.42%), and White/Caucasian (4.8%, a difference of 0.46%).
| Demographics | Rating | Rank | Married-Couple Family Poverty |
| Tongans | 95.9 /100 | #112 | Exceptional 4.7% |
| Immigrants from Nepal | 95.9 /100 | #113 | Exceptional 4.7% |
| Immigrants from Indonesia | 95.1 /100 | #114 | Exceptional 4.8% |
| Taiwanese | 94.8 /100 | #115 | Exceptional 4.8% |
| Celtics | 94.8 /100 | #116 | Exceptional 4.8% |
| Kenyans | 94.7 /100 | #117 | Exceptional 4.8% |
| Immigrants from Philippines | 94.6 /100 | #118 | Exceptional 4.8% |
| Immigrants from Eastern Asia | 94.0 /100 | #119 | Exceptional 4.8% |
| Immigrants from Southern Europe | 93.4 /100 | #120 | Exceptional 4.8% |
| Indians (Asian) | 93.2 /100 | #121 | Exceptional 4.8% |
| Whites/Caucasians | 93.1 /100 | #122 | Exceptional 4.8% |
| Jordanians | 93.1 /100 | #123 | Exceptional 4.8% |
| Romanians | 92.5 /100 | #124 | Exceptional 4.8% |
| Immigrants from Bosnia and Herzegovina | 92.5 /100 | #125 | Exceptional 4.8% |
| Immigrants from Asia | 92.3 /100 | #126 | Exceptional 4.8% |
Immigrants from Eastern Asia Married-Couple Family Poverty Correlation Summary
| Measurement | Immigrants from Eastern Asia Data | Married-Couple Family Poverty Data |
| Minimum | 0.19% | 1.9% |
| Maximum | 49.5% | 20.0% |
| Range | 49.3% | 18.1% |
| Mean | 18.3% | 5.8% |
| Median | 17.3% | 4.3% |
| Interquartile 25% (IQ1) | 8.5% | 3.7% |
| Interquartile 75% (IQ3) | 27.2% | 6.6% |
| Interquartile Range (IQR) | 18.6% | 2.9% |
| Standard Deviation (Sample) | 11.7% | 3.8% |
| Standard Deviation (Population) | 11.7% | 3.8% |
Correlation Details
| Immigrants from Eastern Asia Percentile | Sample Size | Married-Couple Family Poverty |
[ 0.0% - 0.5% ] 0.19% | 170,536,410 | 5.8% |
[ 0.5% - 1.0% ] 0.56% | 112,973,023 | 4.8% |
[ 0.5% - 1.0% ] 0.95% | 55,553,435 | 4.2% |
[ 1.0% - 1.5% ] 1.35% | 32,339,161 | 4.3% |
[ 1.5% - 2.0% ] 1.75% | 23,807,962 | 4.1% |
[ 2.0% - 2.5% ] 2.10% | 12,855,167 | 4.3% |
[ 2.0% - 2.5% ] 2.49% | 9,417,028 | 3.9% |
[ 2.5% - 3.0% ] 2.89% | 7,250,291 | 3.7% |
[ 3.0% - 3.5% ] 3.31% | 10,950,959 | 5.1% |
[ 3.5% - 4.0% ] 3.68% | 6,154,925 | 4.0% |
[ 4.0% - 4.5% ] 4.08% | 3,592,073 | 3.9% |
[ 4.0% - 4.5% ] 4.45% | 4,265,694 | 3.8% |
[ 4.5% - 5.0% ] 4.86% | 3,320,310 | 3.7% |
[ 5.0% - 5.5% ] 5.23% | 2,485,112 | 3.3% |
[ 5.5% - 6.0% ] 5.50% | 10,877,773 | 7.4% |
[ 6.0% - 6.5% ] 6.02% | 2,449,174 | 3.7% |
[ 6.0% - 6.5% ] 6.37% | 1,392,280 | 3.2% |
[ 6.5% - 7.0% ] 6.78% | 1,213,173 | 3.5% |
[ 7.0% - 7.5% ] 7.13% | 1,018,856 | 4.0% |
[ 7.0% - 7.5% ] 7.44% | 1,648,274 | 3.3% |
[ 7.5% - 8.0% ] 7.94% | 1,123,141 | 4.0% |
[ 8.0% - 8.5% ] 8.35% | 1,262,202 | 3.7% |
[ 8.5% - 9.0% ] 8.72% | 1,054,906 | 4.2% |
[ 9.0% - 9.5% ] 9.17% | 1,256,251 | 3.9% |
[ 9.5% - 10.0% ] 9.51% | 615,210 | 3.4% |
[ 9.5% - 10.0% ] 9.86% | 1,004,664 | 4.8% |
[ 10.0% - 10.5% ] 10.21% | 889,513 | 3.1% |
[ 10.5% - 11.0% ] 10.64% | 525,030 | 3.3% |
[ 11.0% - 11.5% ] 11.03% | 298,648 | 3.7% |
[ 11.0% - 11.5% ] 11.39% | 466,311 | 4.5% |
[ 11.5% - 12.0% ] 11.76% | 1,048,196 | 4.0% |
[ 12.0% - 12.5% ] 12.21% | 537,172 | 4.1% |
[ 12.5% - 13.0% ] 12.52% | 587,784 | 3.5% |
[ 13.0% - 13.5% ] 13.04% | 129,376 | 1.9% |
[ 13.0% - 13.5% ] 13.32% | 546,835 | 5.1% |
[ 13.5% - 14.0% ] 13.76% | 1,146,652 | 5.7% |
[ 14.0% - 14.5% ] 14.12% | 470,350 | 4.1% |
[ 14.5% - 15.0% ] 14.61% | 125,434 | 2.9% |
[ 14.5% - 15.0% ] 14.89% | 110,521 | 4.4% |
[ 15.0% - 15.5% ] 15.29% | 273,342 | 2.8% |
[ 15.5% - 16.0% ] 15.73% | 172,210 | 3.6% |
[ 16.0% - 16.5% ] 16.08% | 164,555 | 4.0% |
[ 16.0% - 16.5% ] 16.47% | 180,691 | 2.8% |
[ 16.5% - 17.0% ] 16.83% | 588,902 | 4.0% |
[ 17.0% - 17.5% ] 17.31% | 228,552 | 6.5% |
[ 17.5% - 18.0% ] 17.67% | 82,360 | 4.2% |
[ 18.0% - 18.5% ] 18.44% | 103,062 | 6.7% |
[ 18.5% - 19.0% ] 18.85% | 153,367 | 5.8% |
[ 19.0% - 19.5% ] 19.23% | 118,464 | 13.2% |
[ 19.5% - 20.0% ] 19.55% | 100,680 | 4.2% |
[ 19.5% - 20.0% ] 19.99% | 73,691 | 6.9% |
[ 20.0% - 20.5% ] 20.45% | 346,015 | 5.6% |
[ 20.5% - 21.0% ] 20.67% | 156,580 | 3.6% |
[ 21.0% - 21.5% ] 21.10% | 85,311 | 3.0% |
[ 21.5% - 22.0% ] 21.63% | 34,244 | 2.9% |
[ 21.5% - 22.0% ] 21.86% | 61,110 | 6.1% |
[ 22.0% - 22.5% ] 22.31% | 90,420 | 4.9% |
[ 22.5% - 23.0% ] 22.72% | 80,974 | 6.9% |
[ 22.5% - 23.0% ] 22.94% | 128,109 | 2.7% |
[ 23.0% - 23.5% ] 23.27% | 82,295 | 7.9% |
[ 23.5% - 24.0% ] 23.83% | 99,744 | 7.7% |
[ 24.5% - 25.0% ] 24.60% | 83,601 | 3.7% |
[ 24.5% - 25.0% ] 24.88% | 70,110 | 5.3% |
[ 25.0% - 25.5% ] 25.31% | 76,518 | 19.5% |
[ 25.5% - 26.0% ] 25.88% | 93,008 | 15.1% |
[ 26.0% - 26.5% ] 26.24% | 58,223 | 2.3% |
[ 26.5% - 27.0% ] 26.95% | 1,139 | 17.5% |
[ 27.0% - 27.5% ] 27.42% | 123,259 | 6.4% |
[ 27.5% - 28.0% ] 27.83% | 78,835 | 4.4% |
[ 28.0% - 28.5% ] 28.13% | 33,937 | 9.0% |
[ 28.5% - 29.0% ] 28.57% | 68,923 | 4.4% |
[ 29.0% - 29.5% ] 29.01% | 120,290 | 7.5% |
[ 29.0% - 29.5% ] 29.38% | 44,582 | 7.2% |
[ 29.5% - 30.0% ] 29.63% | 82,746 | 5.6% |
[ 30.0% - 30.5% ] 30.04% | 40,738 | 4.2% |
[ 30.5% - 31.0% ] 30.72% | 41,377 | 5.5% |
[ 31.0% - 31.5% ] 31.42% | 557 | 8.1% |
[ 32.0% - 32.5% ] 32.09% | 430 | 20.0% |
[ 32.0% - 32.5% ] 32.18% | 25,460 | 10.7% |
[ 32.5% - 33.0% ] 32.57% | 60,386 | 8.5% |
[ 33.0% - 33.5% ] 33.18% | 91,060 | 7.6% |
[ 34.0% - 34.5% ] 34.23% | 222 | 5.0% |
[ 36.5% - 37.0% ] 36.60% | 12,070 | 13.4% |
[ 38.0% - 38.5% ] 38.31% | 26,418 | 7.9% |
[ 38.5% - 39.0% ] 38.75% | 25,001 | 2.9% |
[ 39.0% - 39.5% ] 39.39% | 1,107 | 3.1% |
[ 42.0% - 42.5% ] 42.24% | 40,462 | 5.7% |
[ 48.0% - 48.5% ] 48.39% | 57,556 | 15.8% |
[ 49.0% - 49.5% ] 49.50% | 79,495 | 16.6% |