Immigrants from India Married-Couple Family Poverty
COMPARE
Immigrants from India
Select to Compare
Married-Couple Family Poverty
Immigrants from India Married-Couple Family Poverty
3.6%
POVERTY | MARRIED-COUPLE FAMILIES
100.0/ 100
METRIC RATING
1st/ 347
METRIC RANK
Immigrants from India Married-Couple Family Poverty Correlation Chart
The statistical analysis conducted on geographies consisting of 429,262,972 people shows a weak negative correlation between the proportion of Immigrants from India and poverty level among married-couple families in the United States with a correlation coefficient (R) of -0.267 and weighted average of 3.6%. On average, for every 1% (one percent) increase in Immigrants from India within a typical geography, there is a decrease of 0.047% in poverty level among married-couple families.
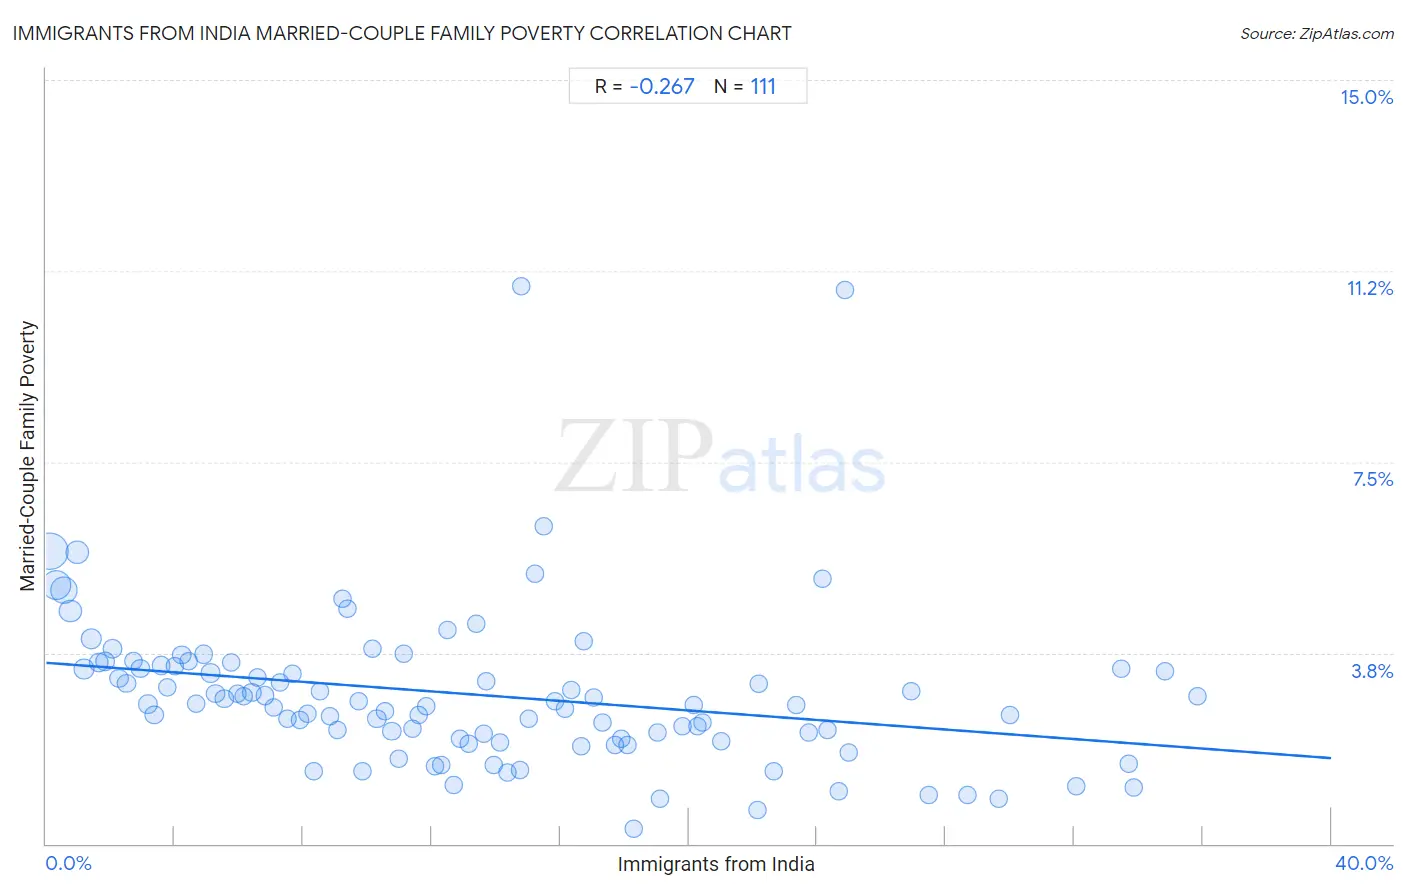
It is essential to understand that the correlation between the percentage of Immigrants from India and poverty level among married-couple families does not imply a direct cause-and-effect relationship. It remains uncertain whether the presence of Immigrants from India influences an upward or downward trend in the level of poverty level among married-couple families within an area, or if Immigrants from India simply ended up residing in those areas with higher or lower levels of poverty level among married-couple families due to other factors.
Demographics Similar to Immigrants from India by Married-Couple Family Poverty
In terms of married-couple family poverty, the demographic groups most similar to Immigrants from India are Chinese (3.6%, a difference of 0.18%), Norwegian (3.7%, a difference of 2.1%), Slovene (3.8%, a difference of 5.7%), Swedish (3.9%, a difference of 5.9%), and Luxembourger (3.9%, a difference of 6.6%).
| Demographics | Rating | Rank | Married-Couple Family Poverty |
| Immigrants from India | 100.0 /100 | #1 | Exceptional 3.6% |
| Chinese | 100.0 /100 | #2 | Exceptional 3.6% |
| Norwegians | 100.0 /100 | #3 | Exceptional 3.7% |
| Slovenes | 100.0 /100 | #4 | Exceptional 3.8% |
| Swedes | 100.0 /100 | #5 | Exceptional 3.9% |
| Luxembourgers | 100.0 /100 | #6 | Exceptional 3.9% |
| Latvians | 100.0 /100 | #7 | Exceptional 3.9% |
| Thais | 100.0 /100 | #8 | Exceptional 3.9% |
| Croatians | 100.0 /100 | #9 | Exceptional 3.9% |
| Carpatho Rusyns | 100.0 /100 | #10 | Exceptional 3.9% |
| Lithuanians | 100.0 /100 | #11 | Exceptional 4.0% |
| Bulgarians | 100.0 /100 | #12 | Exceptional 4.0% |
| Czechs | 100.0 /100 | #13 | Exceptional 4.0% |
| Slovaks | 100.0 /100 | #14 | Exceptional 4.0% |
| Poles | 100.0 /100 | #15 | Exceptional 4.0% |
Immigrants from India Married-Couple Family Poverty Correlation Summary
| Measurement | Immigrants from India Data | Married-Couple Family Poverty Data |
| Minimum | 0.10% | 0.29% |
| Maximum | 35.8% | 10.9% |
| Range | 35.7% | 10.6% |
| Mean | 13.3% | 2.9% |
| Median | 12.1% | 2.7% |
| Interquartile 25% (IQ1) | 6.0% | 2.1% |
| Interquartile 75% (IQ3) | 19.0% | 3.5% |
| Interquartile Range (IQR) | 13.1% | 1.4% |
| Standard Deviation (Sample) | 9.0% | 1.6% |
| Standard Deviation (Population) | 9.0% | 1.6% |
Correlation Details
| Immigrants from India Percentile | Sample Size | Married-Couple Family Poverty |
[ 0.0% - 0.5% ] 0.10% | 127,214,704 | 5.7% |
[ 0.0% - 0.5% ] 0.32% | 75,765,100 | 5.1% |
[ 0.5% - 1.0% ] 0.54% | 57,149,837 | 5.0% |
[ 0.5% - 1.0% ] 0.75% | 28,525,994 | 4.6% |
[ 0.5% - 1.0% ] 0.96% | 36,745,417 | 5.7% |
[ 1.0% - 1.5% ] 1.18% | 13,468,727 | 3.4% |
[ 1.0% - 1.5% ] 1.42% | 16,211,238 | 4.0% |
[ 1.5% - 2.0% ] 1.62% | 8,158,954 | 3.6% |
[ 1.5% - 2.0% ] 1.84% | 7,085,058 | 3.6% |
[ 2.0% - 2.5% ] 2.04% | 8,501,345 | 3.8% |
[ 2.0% - 2.5% ] 2.26% | 5,034,662 | 3.2% |
[ 2.0% - 2.5% ] 2.49% | 4,512,337 | 3.1% |
[ 2.5% - 3.0% ] 2.71% | 3,963,407 | 3.6% |
[ 2.5% - 3.0% ] 2.93% | 3,114,495 | 3.4% |
[ 3.0% - 3.5% ] 3.16% | 3,379,747 | 2.7% |
[ 3.0% - 3.5% ] 3.36% | 1,929,249 | 2.5% |
[ 3.5% - 4.0% ] 3.58% | 1,694,609 | 3.5% |
[ 3.5% - 4.0% ] 3.78% | 2,329,421 | 3.1% |
[ 4.0% - 4.5% ] 4.01% | 1,203,384 | 3.5% |
[ 4.0% - 4.5% ] 4.22% | 1,635,035 | 3.7% |
[ 4.0% - 4.5% ] 4.43% | 1,007,929 | 3.6% |
[ 4.5% - 5.0% ] 4.67% | 1,181,778 | 2.8% |
[ 4.5% - 5.0% ] 4.88% | 1,063,359 | 3.7% |
[ 5.0% - 5.5% ] 5.12% | 857,257 | 3.4% |
[ 5.0% - 5.5% ] 5.27% | 1,537,051 | 3.0% |
[ 5.5% - 6.0% ] 5.54% | 454,476 | 2.8% |
[ 5.5% - 6.0% ] 5.76% | 496,275 | 3.6% |
[ 5.5% - 6.0% ] 5.96% | 979,726 | 3.0% |
[ 6.0% - 6.5% ] 6.16% | 709,321 | 2.9% |
[ 6.0% - 6.5% ] 6.40% | 665,678 | 3.0% |
[ 6.5% - 7.0% ] 6.57% | 542,885 | 3.3% |
[ 6.5% - 7.0% ] 6.81% | 402,738 | 2.9% |
[ 7.0% - 7.5% ] 7.06% | 451,433 | 2.7% |
[ 7.0% - 7.5% ] 7.28% | 390,990 | 3.2% |
[ 7.5% - 8.0% ] 7.50% | 512,578 | 2.4% |
[ 7.5% - 8.0% ] 7.66% | 225,249 | 3.3% |
[ 7.5% - 8.0% ] 7.91% | 599,222 | 2.4% |
[ 8.0% - 8.5% ] 8.15% | 339,716 | 2.6% |
[ 8.0% - 8.5% ] 8.31% | 275,608 | 1.4% |
[ 8.5% - 9.0% ] 8.54% | 325,718 | 3.0% |
[ 8.5% - 9.0% ] 8.82% | 287,880 | 2.5% |
[ 9.0% - 9.5% ] 9.05% | 411,065 | 2.2% |
[ 9.0% - 9.5% ] 9.22% | 256,881 | 4.8% |
[ 9.0% - 9.5% ] 9.39% | 511,369 | 4.6% |
[ 9.5% - 10.0% ] 9.71% | 426,063 | 2.8% |
[ 9.5% - 10.0% ] 9.85% | 311,234 | 1.4% |
[ 10.0% - 10.5% ] 10.16% | 410,549 | 3.8% |
[ 10.0% - 10.5% ] 10.29% | 279,635 | 2.5% |
[ 10.5% - 11.0% ] 10.54% | 331,090 | 2.6% |
[ 10.5% - 11.0% ] 10.76% | 610,237 | 2.2% |
[ 10.5% - 11.0% ] 10.99% | 91,934 | 1.7% |
[ 11.0% - 11.5% ] 11.13% | 104,054 | 3.7% |
[ 11.0% - 11.5% ] 11.40% | 336,350 | 2.3% |
[ 11.5% - 12.0% ] 11.60% | 186,952 | 2.5% |
[ 11.5% - 12.0% ] 11.83% | 190,915 | 2.7% |
[ 12.0% - 12.5% ] 12.11% | 47,175 | 1.5% |
[ 12.0% - 12.5% ] 12.31% | 82,318 | 1.5% |
[ 12.0% - 12.5% ] 12.49% | 168,347 | 4.2% |
[ 12.5% - 13.0% ] 12.67% | 122,114 | 1.2% |
[ 12.5% - 13.0% ] 12.88% | 58,539 | 2.1% |
[ 13.0% - 13.5% ] 13.14% | 62,519 | 2.0% |
[ 13.0% - 13.5% ] 13.39% | 104,532 | 4.3% |
[ 13.5% - 14.0% ] 13.61% | 136,078 | 2.2% |
[ 13.5% - 14.0% ] 13.69% | 128,058 | 3.2% |
[ 13.5% - 14.0% ] 13.94% | 83,315 | 1.6% |
[ 14.0% - 14.5% ] 14.13% | 159,677 | 2.0% |
[ 14.0% - 14.5% ] 14.34% | 88,280 | 1.4% |
[ 14.5% - 15.0% ] 14.73% | 46,765 | 1.4% |
[ 14.5% - 15.0% ] 14.78% | 14,658 | 10.9% |
[ 15.0% - 15.5% ] 15.00% | 202,497 | 2.4% |
[ 15.0% - 15.5% ] 15.21% | 22,030 | 5.3% |
[ 15.5% - 16.0% ] 15.50% | 115,278 | 6.2% |
[ 15.5% - 16.0% ] 15.82% | 84,812 | 2.8% |
[ 16.0% - 16.5% ] 16.13% | 35,507 | 2.7% |
[ 16.0% - 16.5% ] 16.33% | 93,461 | 3.0% |
[ 16.5% - 17.0% ] 16.65% | 256,521 | 1.9% |
[ 16.5% - 17.0% ] 16.73% | 24,444 | 4.0% |
[ 17.0% - 17.5% ] 17.04% | 158,485 | 2.9% |
[ 17.0% - 17.5% ] 17.31% | 15,571 | 2.4% |
[ 17.5% - 18.0% ] 17.71% | 86,266 | 1.9% |
[ 17.5% - 18.0% ] 17.90% | 98,975 | 2.1% |
[ 18.0% - 18.5% ] 18.09% | 140,890 | 1.9% |
[ 18.0% - 18.5% ] 18.31% | 14,345 | 0.29% |
[ 19.0% - 19.5% ] 19.04% | 124,761 | 2.2% |
[ 19.0% - 19.5% ] 19.10% | 11,603 | 0.89% |
[ 19.5% - 20.0% ] 19.82% | 79,891 | 2.3% |
[ 20.0% - 20.5% ] 20.15% | 2,144 | 2.7% |
[ 20.0% - 20.5% ] 20.26% | 316,805 | 2.3% |
[ 20.0% - 20.5% ] 20.44% | 61,414 | 2.4% |
[ 21.0% - 21.5% ] 21.02% | 55,440 | 2.0% |
[ 22.0% - 22.5% ] 22.12% | 22,796 | 0.66% |
[ 22.0% - 22.5% ] 22.19% | 83,765 | 3.1% |
[ 22.5% - 23.0% ] 22.63% | 38,567 | 1.4% |
[ 23.0% - 23.5% ] 23.35% | 27,571 | 2.7% |
[ 23.5% - 24.0% ] 23.73% | 53,464 | 2.2% |
[ 24.0% - 24.5% ] 24.16% | 21,806 | 5.2% |
[ 24.0% - 24.5% ] 24.34% | 5,206 | 2.2% |
[ 24.5% - 25.0% ] 24.65% | 20,954 | 1.0% |
[ 24.5% - 25.0% ] 24.87% | 599 | 10.9% |
[ 24.5% - 25.0% ] 24.96% | 29,756 | 1.8% |
[ 26.5% - 27.0% ] 26.93% | 18,068 | 3.0% |
[ 27.0% - 27.5% ] 27.46% | 5,018 | 0.97% |
[ 28.5% - 29.0% ] 28.69% | 3,695 | 0.97% |
[ 29.5% - 30.0% ] 29.66% | 5,867 | 0.88% |
[ 29.5% - 30.0% ] 29.99% | 64,161 | 2.5% |
[ 32.0% - 32.5% ] 32.07% | 10,514 | 1.1% |
[ 33.0% - 33.5% ] 33.47% | 44,570 | 3.4% |
[ 33.5% - 34.0% ] 33.70% | 22,993 | 1.6% |
[ 33.5% - 34.0% ] 33.85% | 15,585 | 1.1% |
[ 34.5% - 35.0% ] 34.84% | 37,022 | 3.4% |
[ 35.5% - 36.0% ] 35.84% | 39,565 | 2.9% |