Immigrants from Northern Africa Married-Couple Family Poverty

COMPARE

Immigrants from Northern Africa
Race
Ancestry
AfghanAfricanAlaska NativeAlaskan AthabascanAlbanianAleutAlsatianAmericanApacheArabArapahoArgentineanArmenianAssyrian/Chaldean/SyriacAustralianAustrianBahamianBangladeshiBarbadianBasqueBelgianBelizeanBermudanBhutaneseBlackfeetBolivianBrazilianBritishBritish West IndianBulgarianBurmeseCajunCambodianCanadianCape VerdeanCarpatho RusynCelticCentral AmericanCentral American IndianCherokeeCheyenneChickasawChileanChineseChippewaChoctawColombianColvilleComancheCosta RicanCreeCreekCroatianCrowCubanCypriotCzechCzechoslovakianDanishDelawareDominicanDutchDutch West IndianEastern EuropeanEcuadorianEgyptianEnglishEstonianEthiopianEuropeanFijianFilipinoFinnishFrenchFrench American IndianFrench CanadianGermanGerman RussianGhanaianGreekGuamanian/ChamorroGuatemalanGuyaneseHaitianHmongHonduranHopiHoumaHungarianIcelanderIndian (Asian)IndonesianInupiatIranianIraqiIrishIroquoisIsraeliItalianJamaicanJapaneseJordanianKenyanKiowaKoreanLaotianLatvianLebaneseLiberianLithuanianLumbeeLuxembourgerMacedonianMalaysianMalteseMarshalleseMenomineeMexicanMexican American IndianMongolianMoroccanNative HawaiianNavajoNepaleseNew ZealanderNicaraguanNigerianNorthern EuropeanNorwegianOkinawanOsageOttawaPaiutePakistaniPalestinianPanamanianParaguayanPennsylvania GermanPeruvianPimaPolishPortuguesePotawatomiPuebloPuerto RicanPuget Sound SalishRomanianRussianSalvadoranSamoanScandinavianScotch-IrishScottishSeminoleSenegaleseSerbianShoshoneSierra LeoneanSiouxSlavicSlovakSloveneSomaliSouth AfricanSouth AmericanSouth American IndianSoviet UnionSpaniardSpanishSpanish AmericanSpanish American IndianSri LankanSubsaharan AfricanSudaneseSwedishSwissSyrianTaiwaneseThaiTlingit-HaidaTohono O'OdhamTonganTrinidadian and TobagonianTsimshianTurkishU.S. Virgin IslanderUgandanUkrainianUruguayanUteVenezuelanVietnameseWelshWest IndianYakamaYaquiYugoslavianYumanYup'ikZimbabwean
Immigration
NonimmigrantsImmigrantsAfghanistanAfricaAlbaniaArgentinaArmeniaAsiaAustraliaAustriaBahamasBangladeshBarbadosBelarusBelgiumBelizeBoliviaBosnia and HerzegovinaBrazilBulgariaBurma/MyanmarCabo VerdeCambodiaCameroonCanadaCaribbeanCentral AmericaChileChinaColombiaCongoCosta RicaCroatiaCubaCzechoslovakiaDenmarkDominicaDominican RepublicEastern AfricaEastern AsiaEastern EuropeEcuadorEgyptEl SalvadorEnglandEritreaEthiopiaEuropeFijiFranceGermanyGhanaGreeceGrenadaGuatemalaGuyanaHaitiHondurasHong KongHungaryIndiaIndonesiaIranIraqIrelandIsraelItalyJamaicaJapanJordanKazakhstanKenyaKoreaKuwaitLaosLatin AmericaLatviaLebanonLiberiaLithuaniaMalaysiaMexicoMicronesiaMiddle AfricaMoldovaMoroccoNepalNetherlandsNicaraguaNigeriaNorth AmericaNorth MacedoniaNorthern AfricaNorthern EuropeNorwayOceaniaPakistanPanamaPeruPhilippinesPolandPortugalRomaniaRussiaSaudi ArabiaScotlandSenegalSerbiaSierra LeoneSingaporeSomaliaSouth AfricaSouth AmericaSouth Central AsiaSouth Eastern AsiaSouthern EuropeSpainSri LankaSt. Vincent and the GrenadinesSudanSwedenSwitzerlandSyriaTaiwanThailandTrinidad and TobagoTurkeyUgandaUkraineUruguayUzbekistanVenezuelaVietnamWest IndiesWestern AfricaWestern AsiaWestern EuropeYemenZaireZimbabweAzores
Select to Compare
Race
Ancestry
AfghanAfricanAlaska NativeAlaskan AthabascanAlbanianAleutAlsatianAmericanApacheArabArapahoArgentineanArmenianAssyrian/Chaldean/SyriacAustralianAustrianBahamianBangladeshiBarbadianBasqueBelgianBelizeanBermudanBhutaneseBlackfeetBolivianBrazilianBritishBritish West IndianBulgarianBurmeseCajunCambodianCanadianCape VerdeanCarpatho RusynCelticCentral AmericanCentral American IndianCherokeeCheyenneChickasawChileanChineseChippewaChoctawColombianColvilleComancheCosta RicanCreeCreekCroatianCrowCubanCypriotCzechCzechoslovakianDanishDelawareDominicanDutchDutch West IndianEastern EuropeanEcuadorianEgyptianEnglishEstonianEthiopianEuropeanFijianFilipinoFinnishFrenchFrench American IndianFrench CanadianGermanGerman RussianGhanaianGreekGuamanian/ChamorroGuatemalanGuyaneseHaitianHmongHonduranHopiHoumaHungarianIcelanderIndian (Asian)IndonesianInupiatIranianIraqiIrishIroquoisIsraeliItalianJamaicanJapaneseJordanianKenyanKiowaKoreanLaotianLatvianLebaneseLiberianLithuanianLumbeeLuxembourgerMacedonianMalaysianMalteseMarshalleseMenomineeMexicanMexican American IndianMongolianMoroccanNative HawaiianNavajoNepaleseNew ZealanderNicaraguanNigerianNorthern EuropeanNorwegianOkinawanOsageOttawaPaiutePakistaniPalestinianPanamanianParaguayanPennsylvania GermanPeruvianPimaPolishPortuguesePotawatomiPuebloPuerto RicanPuget Sound SalishRomanianRussianSalvadoranSamoanScandinavianScotch-IrishScottishSeminoleSenegaleseSerbianShoshoneSierra LeoneanSiouxSlavicSlovakSloveneSomaliSouth AfricanSouth AmericanSouth American IndianSoviet UnionSpaniardSpanishSpanish AmericanSpanish American IndianSri LankanSubsaharan AfricanSudaneseSwedishSwissSyrianTaiwaneseThaiTlingit-HaidaTohono O'OdhamTonganTrinidadian and TobagonianTsimshianTurkishU.S. Virgin IslanderUgandanUkrainianUruguayanUteVenezuelanVietnameseWelshWest IndianYakamaYaquiYugoslavianYumanYup'ikZimbabwean
Immigration
NonimmigrantsImmigrantsAfghanistanAfricaAlbaniaArgentinaArmeniaAsiaAustraliaAustriaBahamasBangladeshBarbadosBelarusBelgiumBelizeBoliviaBosnia and HerzegovinaBrazilBulgariaBurma/MyanmarCabo VerdeCambodiaCameroonCanadaCaribbeanCentral AmericaChileChinaColombiaCongoCosta RicaCroatiaCubaCzechoslovakiaDenmarkDominicaDominican RepublicEastern AfricaEastern AsiaEastern EuropeEcuadorEgyptEl SalvadorEnglandEritreaEthiopiaEuropeFijiFranceGermanyGhanaGreeceGrenadaGuatemalaGuyanaHaitiHondurasHong KongHungaryIndiaIndonesiaIranIraqIrelandIsraelItalyJamaicaJapanJordanKazakhstanKenyaKoreaKuwaitLaosLatin AmericaLatviaLebanonLiberiaLithuaniaMalaysiaMexicoMicronesiaMiddle AfricaMoldovaMoroccoNepalNetherlandsNicaraguaNigeriaNorth AmericaNorth MacedoniaNorthern EuropeNorwayOceaniaPakistanPanamaPeruPhilippinesPolandPortugalRomaniaRussiaSaudi ArabiaScotlandSenegalSerbiaSierra LeoneSingaporeSomaliaSouth AfricaSouth AmericaSouth Central AsiaSouth Eastern AsiaSouthern EuropeSpainSri LankaSt. Vincent and the GrenadinesSudanSwedenSwitzerlandSyriaTaiwanThailandTrinidad and TobagoTurkeyUgandaUkraineUruguayUzbekistanVenezuelaVietnamWest IndiesWestern AfricaWestern AsiaWestern EuropeYemenZaireZimbabweAzores
Married-Couple Family Poverty
Income
Poverty
Unemployment
Labor Participation
Family Structure
Vehicle Availability
Education Level
Disability

Immigrants from Northern Africa Married-Couple Family Poverty
Average

5.2%
POVERTY | MARRIED-COUPLE FAMILIES
51.3/ 100
METRIC RATING
172nd/ 347
METRIC RANK

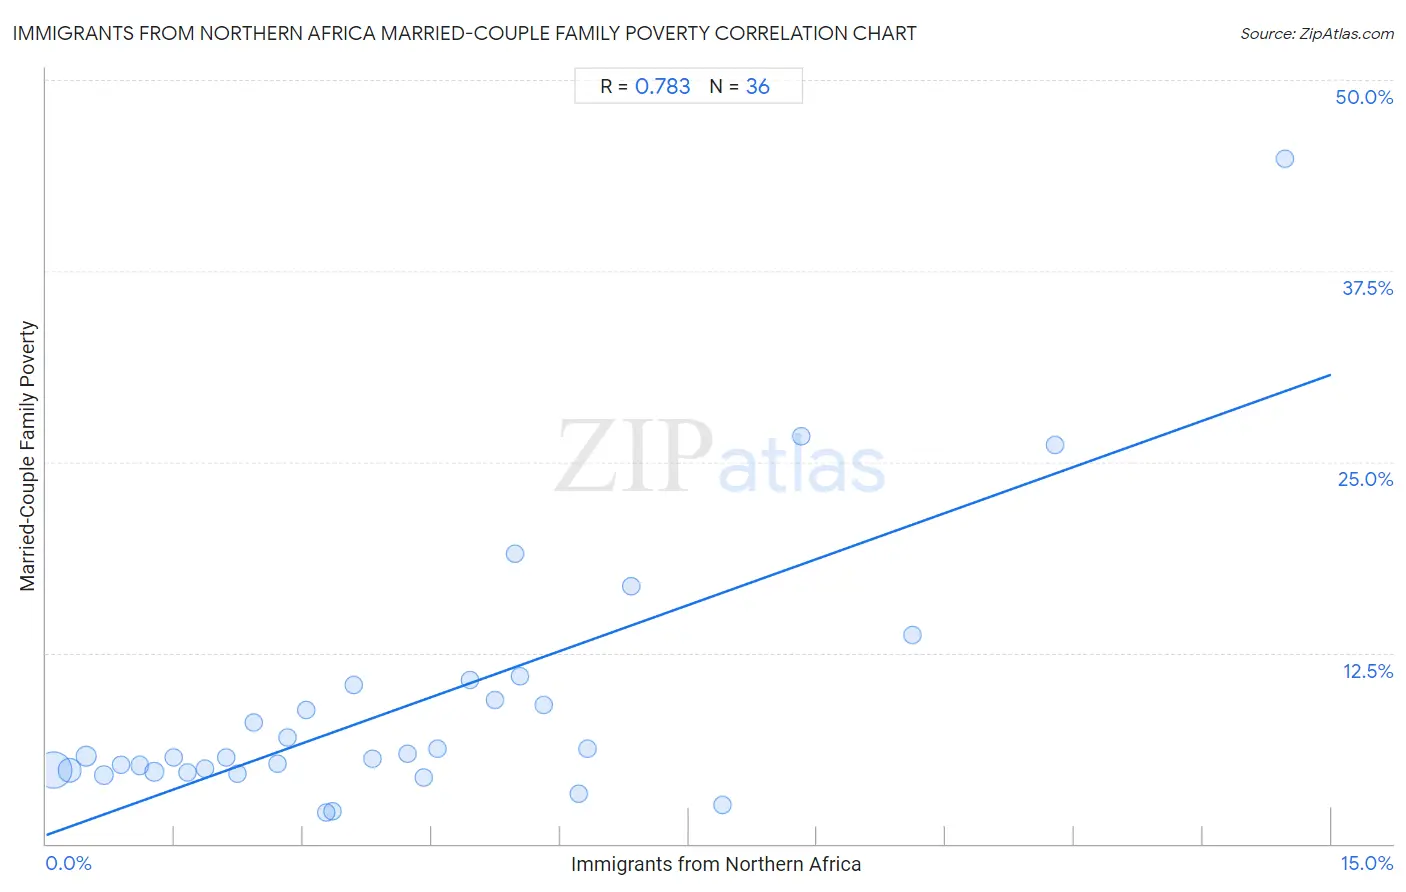
Immigrants from Northern Africa Married-Couple Family Poverty Correlation Chart

The statistical analysis conducted on geographies consisting of 319,156,358 people shows a strong positive correlation between the proportion of Immigrants from Northern Africa and poverty level among married-couple families in the United States with a correlation coefficient (R) of 0.783 and weighted average of 5.2%. On average, for every 1% (one percent) increase in Immigrants from Northern Africa within a typical geography, there is an increase of 2.0% in poverty level among married-couple families.
Immigrants from Northern Africa Married-Couple Family Poverty
It is essential to understand that the correlation between the percentage of Immigrants from Northern Africa and poverty level among married-couple families does not imply a direct cause-and-effect relationship. It remains uncertain whether the presence of Immigrants from Northern Africa influences an upward or downward trend in the level of poverty level among married-couple families within an area, or if Immigrants from Northern Africa simply ended up residing in those areas with higher or lower levels of poverty level among married-couple families due to other factors.

Demographics Similar to Immigrants from Northern Africa by Married-Couple Family Poverty

In terms of married-couple family poverty, the demographic groups most similar to Immigrants from Northern Africa are Alsatian (5.2%, a difference of 0.020%), Immigrants from Eastern Africa (5.2%, a difference of 0.16%), Bermudan (5.2%, a difference of 0.18%), Immigrants from Argentina (5.2%, a difference of 0.35%), and Ottawa (5.2%, a difference of 0.37%).
DemographicsRating | RankMarried-Couple Family Poverty
Immigrants from Malaysia
62.2
/100
|
#165
Good
5.1%
Paraguayans
61.5
/100
|
#166
Good
5.1%
Costa Ricans
61.5
/100
|
#167
Good
5.1%
Immigrants from Uganda
54.9
/100
|
#168
Average
5.2%
Ottawa
54.5
/100
|
#169
Average
5.2%
Immigrants from Argentina
54.4
/100
|
#170
Average
5.2%
Bermudans
52.9
/100
|
#171
Average
5.2%
Immigrants from Northern Africa
51.3
/100
|
#172
Average
5.2%
Alsatians
51.2
/100
|
#173
Average
5.2%
Immigrants from Eastern Africa
50.0
/100
|
#174
Average
5.2%
Marshallese
47.9
/100
|
#175
Average
5.2%
Menominee
47.8
/100
|
#176
Average
5.2%
Immigrants from Kazakhstan
45.1
/100
|
#177
Average
5.2%
Immigrants from Ukraine
44.9
/100
|
#178
Average
5.2%
Spanish
41.4
/100
|
#179
Average
5.3%

Immigrants from Northern Africa Married-Couple Family Poverty Correlation Summary

MeasurementImmigrants from Northern Africa DataMarried-Couple Family Poverty Data
Minimum0.084%2.0%
Maximum14.5%44.8%
Range14.4%42.8%
Mean4.2%9.0%
Median3.5%5.7%
Interquartile 25% (IQ1)1.8%4.8%
Interquartile 75% (IQ3)5.7%9.9%
Interquartile Range (IQR)3.9%5.2%
Standard Deviation (Sample)3.3%8.5%
Standard Deviation (Population)3.3%8.4%

Correlation Details

Immigrants from Northern Africa PercentileSample SizeMarried-Couple Family Poverty
[
0.0%
-
0.5%
]
0.084%
202,605,5734.9%
[
0.0%
-
0.5%
]
0.27%
60,898,9194.8%
[
0.0%
-
0.5%
]
0.46%
28,502,6335.8%
[
0.5%
-
1.0%
]
0.67%
10,760,1694.5%
[
0.5%
-
1.0%
]
0.88%
4,919,6665.1%
[
1.0%
-
1.5%
]
1.09%
3,974,7785.1%
[
1.0%
-
1.5%
]
1.26%
2,346,7624.7%
[
1.0%
-
1.5%
]
1.48%
1,336,4015.6%
[
1.5%
-
2.0%
]
1.64%
797,8184.7%
[
1.5%
-
2.0%
]
1.86%
909,8964.9%
[
2.0%
-
2.5%
]
2.09%
212,9965.7%
[
2.0%
-
2.5%
]
2.24%
423,8254.6%
[
2.0%
-
2.5%
]
2.43%
157,9767.9%
[
2.5%
-
3.0%
]
2.70%
182,1495.3%
[
2.5%
-
3.0%
]
2.81%
382,6597.0%
[
3.0%
-
3.5%
]
3.04%
58,2678.8%
[
3.0%
-
3.5%
]
3.28%
57,8282.0%
[
3.0%
-
3.5%
]
3.35%
14,1022.2%
[
3.5%
-
4.0%
]
3.59%
20,05810.4%
[
3.5%
-
4.0%
]
3.80%
22,0315.5%
[
4.0%
-
4.5%
]
4.22%
46,7875.9%
[
4.0%
-
4.5%
]
4.41%
12,4244.4%
[
4.5%
-
5.0%
]
4.56%
33,6276.2%
[
4.5%
-
5.0%
]
4.95%
37,51410.7%
[
5.0%
-
5.5%
]
5.24%
223,5329.4%
[
5.0%
-
5.5%
]
5.48%
34719.0%
[
5.5%
-
6.0%
]
5.53%
51,69511.0%
[
5.5%
-
6.0%
]
5.81%
2,0319.1%
[
6.0%
-
6.5%
]
6.22%
8,8153.2%
[
6.0%
-
6.5%
]
6.32%
140,9946.3%
[
6.5%
-
7.0%
]
6.83%
1,21516.9%
[
7.5%
-
8.0%
]
7.90%
6,9382.5%
[
8.5%
-
9.0%
]
8.81%
1,33926.7%
[
10.0%
-
10.5%
]
10.12%
1,20613.6%
[
11.5%
-
12.0%
]
11.78%
3,05626.1%
[
14.0%
-
14.5%
]
14.46%
33244.8%