Immigrants from El Salvador Married-Couple Family Poverty
COMPARE
Immigrants from El Salvador
Select to Compare
Married-Couple Family Poverty
Immigrants from El Salvador Married-Couple Family Poverty
6.8%
POVERTY | MARRIED-COUPLE FAMILIES
0.0/ 100
METRIC RATING
303rd/ 347
METRIC RANK
Immigrants from El Salvador Married-Couple Family Poverty Correlation Chart
The statistical analysis conducted on geographies consisting of 355,612,998 people shows a poor positive correlation between the proportion of Immigrants from El Salvador and poverty level among married-couple families in the United States with a correlation coefficient (R) of 0.158 and weighted average of 6.8%. On average, for every 1% (one percent) increase in Immigrants from El Salvador within a typical geography, there is an increase of 0.083% in poverty level among married-couple families.
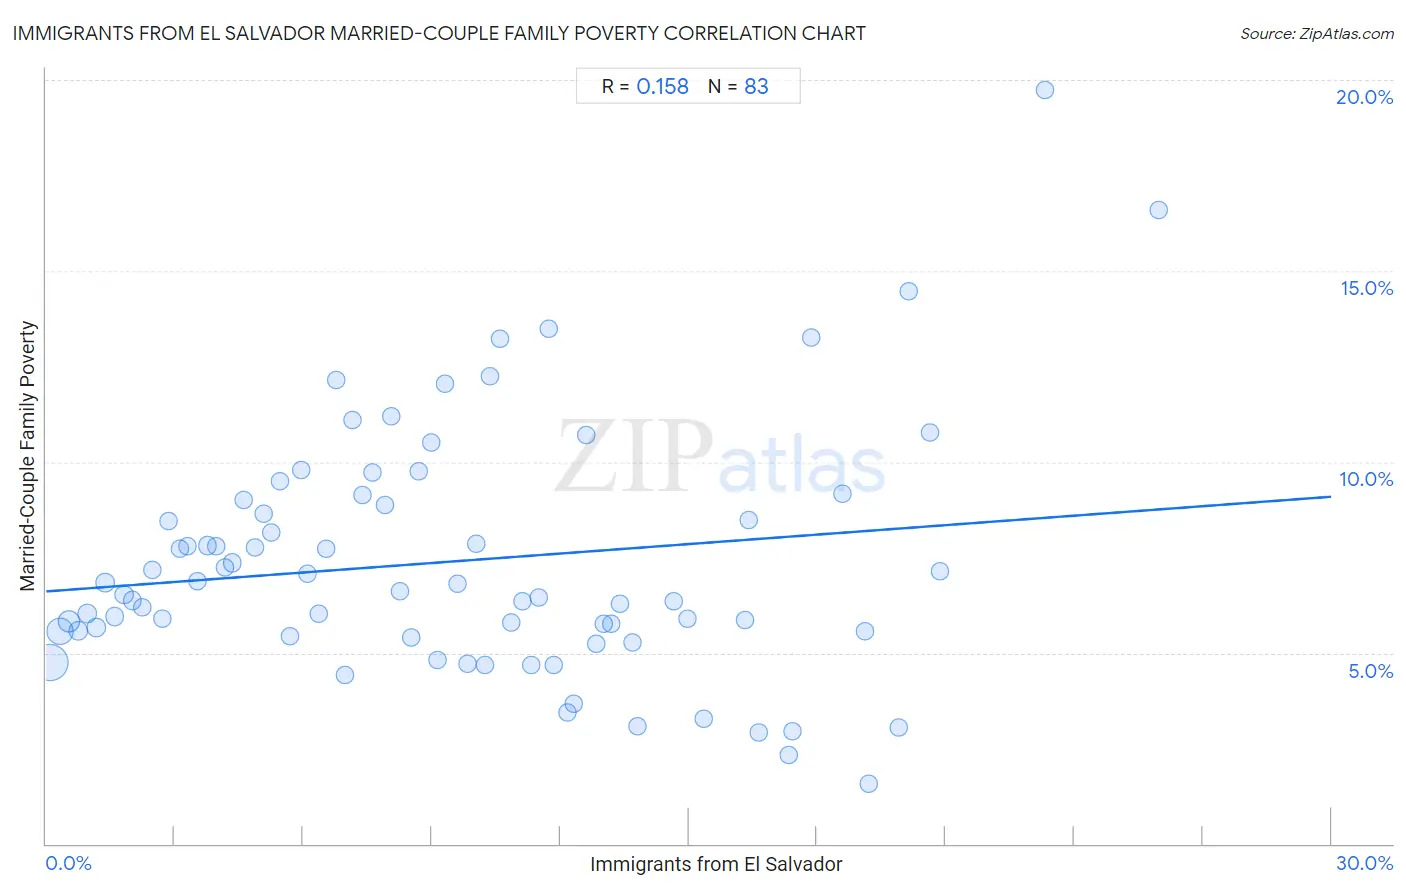
It is essential to understand that the correlation between the percentage of Immigrants from El Salvador and poverty level among married-couple families does not imply a direct cause-and-effect relationship. It remains uncertain whether the presence of Immigrants from El Salvador influences an upward or downward trend in the level of poverty level among married-couple families within an area, or if Immigrants from El Salvador simply ended up residing in those areas with higher or lower levels of poverty level among married-couple families due to other factors.
Demographics Similar to Immigrants from El Salvador by Married-Couple Family Poverty
In terms of married-couple family poverty, the demographic groups most similar to Immigrants from El Salvador are Immigrants from Ecuador (6.7%, a difference of 0.28%), Central American (6.7%, a difference of 0.42%), Cuban (6.8%, a difference of 0.44%), Haitian (6.8%, a difference of 0.55%), and Immigrants from Belize (6.7%, a difference of 1.0%).
| Demographics | Rating | Rank | Married-Couple Family Poverty |
| U.S. Virgin Islanders | 0.0 /100 | #296 | Tragic 6.6% |
| Kiowa | 0.0 /100 | #297 | Tragic 6.6% |
| Immigrants from Guyana | 0.0 /100 | #298 | Tragic 6.7% |
| Nicaraguans | 0.0 /100 | #299 | Tragic 6.7% |
| Immigrants from Belize | 0.0 /100 | #300 | Tragic 6.7% |
| Central Americans | 0.0 /100 | #301 | Tragic 6.7% |
| Immigrants from Ecuador | 0.0 /100 | #302 | Tragic 6.7% |
| Immigrants from El Salvador | 0.0 /100 | #303 | Tragic 6.8% |
| Cubans | 0.0 /100 | #304 | Tragic 6.8% |
| Haitians | 0.0 /100 | #305 | Tragic 6.8% |
| Immigrants from Haiti | 0.0 /100 | #306 | Tragic 7.0% |
| Guatemalans | 0.0 /100 | #307 | Tragic 7.0% |
| Spanish American Indians | 0.0 /100 | #308 | Tragic 7.1% |
| Hopi | 0.0 /100 | #309 | Tragic 7.1% |
| Immigrants from Nicaragua | 0.0 /100 | #310 | Tragic 7.1% |
Immigrants from El Salvador Married-Couple Family Poverty Correlation Summary
| Measurement | Immigrants from El Salvador Data | Married-Couple Family Poverty Data |
| Minimum | 0.094% | 1.6% |
| Maximum | 26.0% | 19.7% |
| Range | 25.9% | 18.2% |
| Mean | 9.5% | 7.4% |
| Median | 9.0% | 6.6% |
| Interquartile 25% (IQ1) | 4.3% | 5.6% |
| Interquartile 75% (IQ3) | 13.4% | 9.0% |
| Interquartile Range (IQR) | 9.1% | 3.4% |
| Standard Deviation (Sample) | 6.2% | 3.2% |
| Standard Deviation (Population) | 6.1% | 3.2% |
Correlation Details
| Immigrants from El Salvador Percentile | Sample Size | Married-Couple Family Poverty |
[ 0.0% - 0.5% ] 0.094% | 159,607,273 | 4.7% |
[ 0.0% - 0.5% ] 0.32% | 73,486,762 | 5.6% |
[ 0.5% - 1.0% ] 0.53% | 29,086,843 | 5.8% |
[ 0.5% - 1.0% ] 0.75% | 18,179,342 | 5.6% |
[ 0.5% - 1.0% ] 0.96% | 15,098,242 | 6.0% |
[ 1.0% - 1.5% ] 1.16% | 9,898,542 | 5.7% |
[ 1.0% - 1.5% ] 1.39% | 8,333,759 | 6.8% |
[ 1.5% - 2.0% ] 1.60% | 5,598,157 | 5.9% |
[ 1.5% - 2.0% ] 1.82% | 4,153,023 | 6.5% |
[ 2.0% - 2.5% ] 2.02% | 2,785,821 | 6.4% |
[ 2.0% - 2.5% ] 2.24% | 2,832,060 | 6.2% |
[ 2.0% - 2.5% ] 2.47% | 2,180,414 | 7.2% |
[ 2.5% - 3.0% ] 2.70% | 1,840,247 | 5.9% |
[ 2.5% - 3.0% ] 2.85% | 3,595,301 | 8.4% |
[ 3.0% - 3.5% ] 3.11% | 1,210,072 | 7.7% |
[ 3.0% - 3.5% ] 3.30% | 1,066,298 | 7.8% |
[ 3.5% - 4.0% ] 3.52% | 1,051,805 | 6.9% |
[ 3.5% - 4.0% ] 3.76% | 866,237 | 7.8% |
[ 3.5% - 4.0% ] 3.97% | 635,164 | 7.8% |
[ 4.0% - 4.5% ] 4.18% | 502,908 | 7.2% |
[ 4.0% - 4.5% ] 4.35% | 4,427,979 | 7.4% |
[ 4.5% - 5.0% ] 4.62% | 675,355 | 9.0% |
[ 4.5% - 5.0% ] 4.87% | 605,902 | 7.7% |
[ 5.0% - 5.5% ] 5.07% | 594,500 | 8.6% |
[ 5.0% - 5.5% ] 5.25% | 294,869 | 8.1% |
[ 5.0% - 5.5% ] 5.47% | 693,696 | 9.5% |
[ 5.5% - 6.0% ] 5.69% | 374,196 | 5.4% |
[ 5.5% - 6.0% ] 5.94% | 217,826 | 9.8% |
[ 6.0% - 6.5% ] 6.11% | 238,169 | 7.1% |
[ 6.0% - 6.5% ] 6.35% | 150,698 | 6.0% |
[ 6.5% - 7.0% ] 6.53% | 456,501 | 7.7% |
[ 6.5% - 7.0% ] 6.76% | 398,215 | 12.1% |
[ 6.5% - 7.0% ] 6.98% | 97,188 | 4.4% |
[ 7.0% - 7.5% ] 7.16% | 160,131 | 11.1% |
[ 7.0% - 7.5% ] 7.37% | 291,209 | 9.1% |
[ 7.5% - 8.0% ] 7.62% | 242,166 | 9.7% |
[ 7.5% - 8.0% ] 7.90% | 82,344 | 8.9% |
[ 8.0% - 8.5% ] 8.07% | 109,705 | 11.2% |
[ 8.0% - 8.5% ] 8.26% | 367,588 | 6.6% |
[ 8.5% - 9.0% ] 8.53% | 339,140 | 5.4% |
[ 8.5% - 9.0% ] 8.71% | 150,500 | 9.8% |
[ 8.5% - 9.0% ] 8.99% | 94,269 | 10.5% |
[ 9.0% - 9.5% ] 9.13% | 155,953 | 4.8% |
[ 9.0% - 9.5% ] 9.32% | 326,786 | 12.0% |
[ 9.5% - 10.0% ] 9.59% | 94,609 | 6.8% |
[ 9.5% - 10.0% ] 9.82% | 135,828 | 4.7% |
[ 10.0% - 10.5% ] 10.05% | 103,022 | 7.9% |
[ 10.0% - 10.5% ] 10.25% | 33,408 | 4.7% |
[ 10.0% - 10.5% ] 10.37% | 64,890 | 12.2% |
[ 10.5% - 11.0% ] 10.59% | 114,601 | 13.2% |
[ 10.5% - 11.0% ] 10.85% | 9,431 | 5.8% |
[ 11.0% - 11.5% ] 11.12% | 25,324 | 6.4% |
[ 11.0% - 11.5% ] 11.32% | 201,194 | 4.7% |
[ 11.0% - 11.5% ] 11.49% | 42,619 | 6.5% |
[ 11.5% - 12.0% ] 11.75% | 630 | 13.5% |
[ 11.5% - 12.0% ] 11.84% | 32,191 | 4.7% |
[ 12.0% - 12.5% ] 12.16% | 59,604 | 3.4% |
[ 12.0% - 12.5% ] 12.30% | 91,938 | 3.7% |
[ 12.5% - 13.0% ] 12.62% | 103 | 10.7% |
[ 12.5% - 13.0% ] 12.84% | 126,256 | 5.3% |
[ 13.0% - 13.5% ] 13.01% | 85,124 | 5.8% |
[ 13.0% - 13.5% ] 13.19% | 74,842 | 5.8% |
[ 13.0% - 13.5% ] 13.40% | 120,534 | 6.3% |
[ 13.5% - 14.0% ] 13.69% | 22,966 | 5.3% |
[ 13.5% - 14.0% ] 13.80% | 31,411 | 3.1% |
[ 14.5% - 15.0% ] 14.64% | 87,056 | 6.4% |
[ 14.5% - 15.0% ] 14.97% | 154,449 | 5.9% |
[ 15.0% - 15.5% ] 15.36% | 34,625 | 3.3% |
[ 16.0% - 16.5% ] 16.32% | 15,127 | 5.9% |
[ 16.0% - 16.5% ] 16.40% | 16,944 | 8.5% |
[ 16.5% - 17.0% ] 16.63% | 6,947 | 2.9% |
[ 17.0% - 17.5% ] 17.32% | 6,218 | 2.3% |
[ 17.0% - 17.5% ] 17.42% | 3,851 | 3.0% |
[ 17.5% - 18.0% ] 17.85% | 24,744 | 13.2% |
[ 18.5% - 19.0% ] 18.58% | 79,765 | 9.2% |
[ 19.0% - 19.5% ] 19.10% | 9,031 | 5.6% |
[ 19.0% - 19.5% ] 19.20% | 7,094 | 1.6% |
[ 19.5% - 20.0% ] 19.89% | 10,563 | 3.1% |
[ 20.0% - 20.5% ] 20.12% | 18,080 | 14.5% |
[ 20.5% - 21.0% ] 20.62% | 50,387 | 10.8% |
[ 20.5% - 21.0% ] 20.87% | 35,908 | 7.2% |
[ 23.0% - 23.5% ] 23.33% | 14,162 | 19.7% |
[ 25.5% - 26.0% ] 25.98% | 14,367 | 16.6% |