Immigrants from Belgium Married-Couple Family Poverty
COMPARE
Immigrants from Belgium
Select to Compare
Married-Couple Family Poverty
Immigrants from Belgium Married-Couple Family Poverty
4.6%
POVERTY | MARRIED-COUPLE FAMILIES
98.2/ 100
METRIC RATING
97th/ 347
METRIC RANK
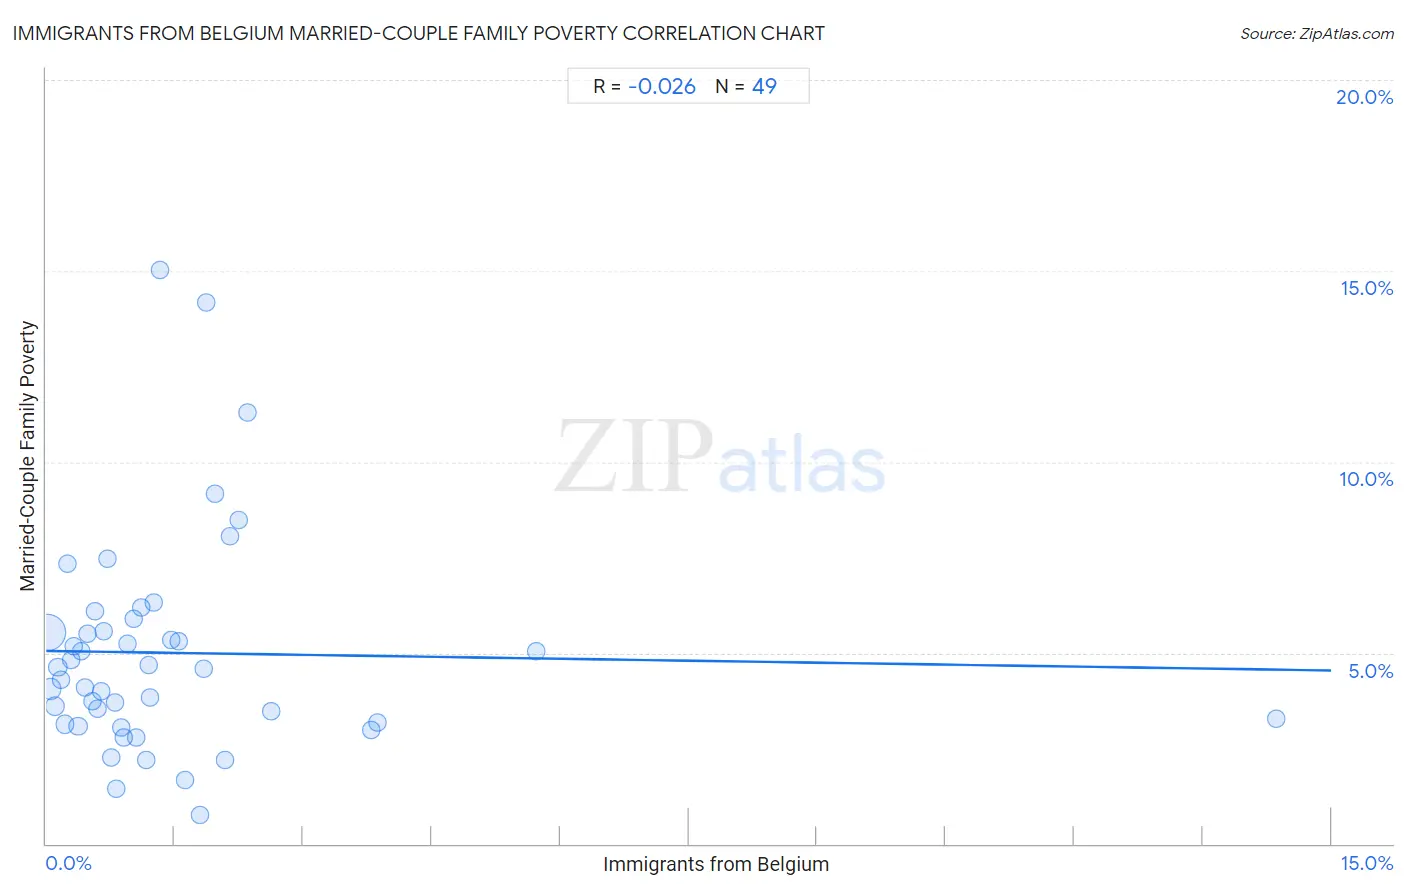
Immigrants from Belgium Married-Couple Family Poverty Correlation Chart
The statistical analysis conducted on geographies consisting of 146,091,061 people shows no correlation between the proportion of Immigrants from Belgium and poverty level among married-couple families in the United States with a correlation coefficient (R) of -0.026 and weighted average of 4.6%. On average, for every 1% (one percent) increase in Immigrants from Belgium within a typical geography, there is a decrease of 0.034% in poverty level among married-couple families.
It is essential to understand that the correlation between the percentage of Immigrants from Belgium and poverty level among married-couple families does not imply a direct cause-and-effect relationship. It remains uncertain whether the presence of Immigrants from Belgium influences an upward or downward trend in the level of poverty level among married-couple families within an area, or if Immigrants from Belgium simply ended up residing in those areas with higher or lower levels of poverty level among married-couple families due to other factors.
Demographics Similar to Immigrants from Belgium by Married-Couple Family Poverty
In terms of married-couple family poverty, the demographic groups most similar to Immigrants from Belgium are Immigrants from Poland (4.6%, a difference of 0.050%), Portuguese (4.6%, a difference of 0.13%), Immigrants from Italy (4.6%, a difference of 0.17%), Korean (4.6%, a difference of 0.22%), and Immigrants from Norway (4.6%, a difference of 0.40%).
| Demographics | Rating | Rank | Married-Couple Family Poverty |
| Immigrants from Switzerland | 98.5 /100 | #90 | Exceptional 4.6% |
| Basques | 98.5 /100 | #91 | Exceptional 4.6% |
| Immigrants from Norway | 98.4 /100 | #92 | Exceptional 4.6% |
| Koreans | 98.3 /100 | #93 | Exceptional 4.6% |
| Immigrants from Italy | 98.3 /100 | #94 | Exceptional 4.6% |
| Portuguese | 98.3 /100 | #95 | Exceptional 4.6% |
| Immigrants from Poland | 98.3 /100 | #96 | Exceptional 4.6% |
| Immigrants from Belgium | 98.2 /100 | #97 | Exceptional 4.6% |
| Native Hawaiians | 98.0 /100 | #98 | Exceptional 4.6% |
| Immigrants from Europe | 97.9 /100 | #99 | Exceptional 4.6% |
| Immigrants from Western Europe | 97.9 /100 | #100 | Exceptional 4.6% |
| Yugoslavians | 97.8 /100 | #101 | Exceptional 4.6% |
| Asians | 97.6 /100 | #102 | Exceptional 4.7% |
| Immigrants from Romania | 97.3 /100 | #103 | Exceptional 4.7% |
| Immigrants from Moldova | 97.1 /100 | #104 | Exceptional 4.7% |
Immigrants from Belgium Married-Couple Family Poverty Correlation Summary
| Measurement | Immigrants from Belgium Data | Married-Couple Family Poverty Data |
| Minimum | 0.016% | 0.74% |
| Maximum | 14.4% | 15.0% |
| Range | 14.3% | 14.3% |
| Mean | 1.5% | 5.0% |
| Median | 0.94% | 4.6% |
| Interquartile 25% (IQ1) | 0.47% | 3.1% |
| Interquartile 75% (IQ3) | 1.8% | 5.7% |
| Interquartile Range (IQR) | 1.4% | 2.6% |
| Standard Deviation (Sample) | 2.2% | 2.9% |
| Standard Deviation (Population) | 2.1% | 2.8% |
Correlation Details
| Immigrants from Belgium Percentile | Sample Size | Married-Couple Family Poverty |
[ 0.0% - 0.5% ] 0.016% | 108,543,467 | 5.5% |
[ 0.0% - 0.5% ] 0.055% | 19,754,322 | 4.1% |
[ 0.0% - 0.5% ] 0.096% | 7,742,145 | 3.6% |
[ 0.0% - 0.5% ] 0.13% | 3,441,789 | 4.6% |
[ 0.0% - 0.5% ] 0.17% | 2,568,335 | 4.3% |
[ 0.0% - 0.5% ] 0.21% | 1,089,876 | 3.1% |
[ 0.0% - 0.5% ] 0.25% | 631,578 | 7.3% |
[ 0.0% - 0.5% ] 0.29% | 617,550 | 4.8% |
[ 0.0% - 0.5% ] 0.33% | 383,017 | 5.2% |
[ 0.0% - 0.5% ] 0.37% | 228,874 | 3.1% |
[ 0.0% - 0.5% ] 0.40% | 260,825 | 5.0% |
[ 0.0% - 0.5% ] 0.45% | 123,587 | 4.1% |
[ 0.0% - 0.5% ] 0.49% | 84,199 | 5.5% |
[ 0.5% - 1.0% ] 0.53% | 124,065 | 3.7% |
[ 0.5% - 1.0% ] 0.56% | 141,637 | 6.1% |
[ 0.5% - 1.0% ] 0.60% | 60,606 | 3.5% |
[ 0.5% - 1.0% ] 0.64% | 19,154 | 4.0% |
[ 0.5% - 1.0% ] 0.68% | 10,623 | 5.6% |
[ 0.5% - 1.0% ] 0.72% | 11,884 | 7.5% |
[ 0.5% - 1.0% ] 0.76% | 25,403 | 2.3% |
[ 0.5% - 1.0% ] 0.80% | 12,085 | 3.7% |
[ 0.5% - 1.0% ] 0.82% | 25,376 | 1.4% |
[ 0.5% - 1.0% ] 0.87% | 112,457 | 3.1% |
[ 0.5% - 1.0% ] 0.90% | 3,788 | 2.8% |
[ 0.5% - 1.0% ] 0.94% | 3,187 | 5.2% |
[ 1.0% - 1.5% ] 1.02% | 2,054 | 5.9% |
[ 1.0% - 1.5% ] 1.06% | 27,059 | 2.8% |
[ 1.0% - 1.5% ] 1.11% | 5,856 | 6.2% |
[ 1.0% - 1.5% ] 1.16% | 1,719 | 2.2% |
[ 1.0% - 1.5% ] 1.20% | 2,000 | 4.7% |
[ 1.0% - 1.5% ] 1.21% | 3,628 | 3.8% |
[ 1.0% - 1.5% ] 1.26% | 1,909 | 6.3% |
[ 1.0% - 1.5% ] 1.33% | 2,185 | 15.0% |
[ 1.0% - 1.5% ] 1.47% | 1,296 | 5.4% |
[ 1.5% - 2.0% ] 1.54% | 7,262 | 5.3% |
[ 1.5% - 2.0% ] 1.62% | 616 | 1.7% |
[ 1.5% - 2.0% ] 1.80% | 1,112 | 0.74% |
[ 1.5% - 2.0% ] 1.84% | 2,115 | 4.6% |
[ 1.5% - 2.0% ] 1.87% | 642 | 14.2% |
[ 1.5% - 2.0% ] 1.97% | 1,220 | 9.2% |
[ 2.0% - 2.5% ] 2.09% | 287 | 2.2% |
[ 2.0% - 2.5% ] 2.14% | 280 | 8.1% |
[ 2.0% - 2.5% ] 2.25% | 267 | 8.5% |
[ 2.0% - 2.5% ] 2.35% | 810 | 11.3% |
[ 2.5% - 3.0% ] 2.63% | 2,890 | 3.5% |
[ 3.5% - 4.0% ] 3.79% | 554 | 3.0% |
[ 3.5% - 4.0% ] 3.87% | 4,468 | 3.2% |
[ 5.5% - 6.0% ] 5.72% | 787 | 5.0% |
[ 14.0% - 14.5% ] 14.35% | 216 | 3.3% |