West Indian Married-Couple Family Poverty

COMPARE

West Indian
Race
Ancestry
AfghanAfricanAlaska NativeAlaskan AthabascanAlbanianAleutAlsatianAmericanApacheArabArapahoArgentineanArmenianAssyrian/Chaldean/SyriacAustralianAustrianBahamianBangladeshiBarbadianBasqueBelgianBelizeanBermudanBhutaneseBlackfeetBolivianBrazilianBritishBritish West IndianBulgarianBurmeseCajunCambodianCanadianCape VerdeanCarpatho RusynCelticCentral AmericanCentral American IndianCherokeeCheyenneChickasawChileanChineseChippewaChoctawColombianColvilleComancheCosta RicanCreeCreekCroatianCrowCubanCypriotCzechCzechoslovakianDanishDelawareDominicanDutchDutch West IndianEastern EuropeanEcuadorianEgyptianEnglishEstonianEthiopianEuropeanFijianFilipinoFinnishFrenchFrench American IndianFrench CanadianGermanGerman RussianGhanaianGreekGuamanian/ChamorroGuatemalanGuyaneseHaitianHmongHonduranHopiHoumaHungarianIcelanderIndian (Asian)IndonesianInupiatIranianIraqiIrishIroquoisIsraeliItalianJamaicanJapaneseJordanianKenyanKiowaKoreanLaotianLatvianLebaneseLiberianLithuanianLumbeeLuxembourgerMacedonianMalaysianMalteseMarshalleseMenomineeMexicanMexican American IndianMongolianMoroccanNative HawaiianNavajoNepaleseNew ZealanderNicaraguanNigerianNorthern EuropeanNorwegianOkinawanOsageOttawaPaiutePakistaniPalestinianPanamanianParaguayanPennsylvania GermanPeruvianPimaPolishPortuguesePotawatomiPuebloPuerto RicanPuget Sound SalishRomanianRussianSalvadoranSamoanScandinavianScotch-IrishScottishSeminoleSenegaleseSerbianShoshoneSierra LeoneanSiouxSlavicSlovakSloveneSomaliSouth AfricanSouth AmericanSouth American IndianSoviet UnionSpaniardSpanishSpanish AmericanSpanish American IndianSri LankanSubsaharan AfricanSudaneseSwedishSwissSyrianTaiwaneseThaiTlingit-HaidaTohono O'OdhamTonganTrinidadian and TobagonianTsimshianTurkishU.S. Virgin IslanderUgandanUkrainianUruguayanUteVenezuelanVietnameseWelshWest IndianYakamaYaquiYugoslavianYumanYup'ikZimbabwean
Immigration
NonimmigrantsImmigrantsAfghanistanAfricaAlbaniaArgentinaArmeniaAsiaAustraliaAustriaBahamasBangladeshBarbadosBelarusBelgiumBelizeBoliviaBosnia and HerzegovinaBrazilBulgariaBurma/MyanmarCabo VerdeCambodiaCameroonCanadaCaribbeanCentral AmericaChileChinaColombiaCongoCosta RicaCroatiaCubaCzechoslovakiaDenmarkDominicaDominican RepublicEastern AfricaEastern AsiaEastern EuropeEcuadorEgyptEl SalvadorEnglandEritreaEthiopiaEuropeFijiFranceGermanyGhanaGreeceGrenadaGuatemalaGuyanaHaitiHondurasHong KongHungaryIndiaIndonesiaIranIraqIrelandIsraelItalyJamaicaJapanJordanKazakhstanKenyaKoreaKuwaitLaosLatin AmericaLatviaLebanonLiberiaLithuaniaMalaysiaMexicoMicronesiaMiddle AfricaMoldovaMoroccoNepalNetherlandsNicaraguaNigeriaNorth AmericaNorth MacedoniaNorthern AfricaNorthern EuropeNorwayOceaniaPakistanPanamaPeruPhilippinesPolandPortugalRomaniaRussiaSaudi ArabiaScotlandSenegalSerbiaSierra LeoneSingaporeSomaliaSouth AfricaSouth AmericaSouth Central AsiaSouth Eastern AsiaSouthern EuropeSpainSri LankaSt. Vincent and the GrenadinesSudanSwedenSwitzerlandSyriaTaiwanThailandTrinidad and TobagoTurkeyUgandaUkraineUruguayUzbekistanVenezuelaVietnamWest IndiesWestern AfricaWestern AsiaWestern EuropeYemenZaireZimbabweAzores
Select to Compare
Race
Ancestry
AfghanAfricanAlaska NativeAlaskan AthabascanAlbanianAleutAlsatianAmericanApacheArabArapahoArgentineanArmenianAssyrian/Chaldean/SyriacAustralianAustrianBahamianBangladeshiBarbadianBasqueBelgianBelizeanBermudanBhutaneseBlackfeetBolivianBrazilianBritishBritish West IndianBulgarianBurmeseCajunCambodianCanadianCape VerdeanCarpatho RusynCelticCentral AmericanCentral American IndianCherokeeCheyenneChickasawChileanChineseChippewaChoctawColombianColvilleComancheCosta RicanCreeCreekCroatianCrowCubanCypriotCzechCzechoslovakianDanishDelawareDominicanDutchDutch West IndianEastern EuropeanEcuadorianEgyptianEnglishEstonianEthiopianEuropeanFijianFilipinoFinnishFrenchFrench American IndianFrench CanadianGermanGerman RussianGhanaianGreekGuamanian/ChamorroGuatemalanGuyaneseHaitianHmongHonduranHopiHoumaHungarianIcelanderIndian (Asian)IndonesianInupiatIranianIraqiIrishIroquoisIsraeliItalianJamaicanJapaneseJordanianKenyanKiowaKoreanLaotianLatvianLebaneseLiberianLithuanianLumbeeLuxembourgerMacedonianMalaysianMalteseMarshalleseMenomineeMexicanMexican American IndianMongolianMoroccanNative HawaiianNavajoNepaleseNew ZealanderNicaraguanNigerianNorthern EuropeanNorwegianOkinawanOsageOttawaPaiutePakistaniPalestinianPanamanianParaguayanPennsylvania GermanPeruvianPimaPolishPortuguesePotawatomiPuebloPuerto RicanPuget Sound SalishRomanianRussianSalvadoranSamoanScandinavianScotch-IrishScottishSeminoleSenegaleseSerbianShoshoneSierra LeoneanSiouxSlavicSlovakSloveneSomaliSouth AfricanSouth AmericanSouth American IndianSoviet UnionSpaniardSpanishSpanish AmericanSpanish American IndianSri LankanSubsaharan AfricanSudaneseSwedishSwissSyrianTaiwaneseThaiTlingit-HaidaTohono O'OdhamTonganTrinidadian and TobagonianTsimshianTurkishU.S. Virgin IslanderUgandanUkrainianUruguayanUteVenezuelanVietnameseWelshYakamaYaquiYugoslavianYumanYup'ikZimbabwean
Immigration
NonimmigrantsImmigrantsAfghanistanAfricaAlbaniaArgentinaArmeniaAsiaAustraliaAustriaBahamasBangladeshBarbadosBelarusBelgiumBelizeBoliviaBosnia and HerzegovinaBrazilBulgariaBurma/MyanmarCabo VerdeCambodiaCameroonCanadaCaribbeanCentral AmericaChileChinaColombiaCongoCosta RicaCroatiaCubaCzechoslovakiaDenmarkDominicaDominican RepublicEastern AfricaEastern AsiaEastern EuropeEcuadorEgyptEl SalvadorEnglandEritreaEthiopiaEuropeFijiFranceGermanyGhanaGreeceGrenadaGuatemalaGuyanaHaitiHondurasHong KongHungaryIndiaIndonesiaIranIraqIrelandIsraelItalyJamaicaJapanJordanKazakhstanKenyaKoreaKuwaitLaosLatin AmericaLatviaLebanonLiberiaLithuaniaMalaysiaMexicoMicronesiaMiddle AfricaMoldovaMoroccoNepalNetherlandsNicaraguaNigeriaNorth AmericaNorth MacedoniaNorthern AfricaNorthern EuropeNorwayOceaniaPakistanPanamaPeruPhilippinesPolandPortugalRomaniaRussiaSaudi ArabiaScotlandSenegalSerbiaSierra LeoneSingaporeSomaliaSouth AfricaSouth AmericaSouth Central AsiaSouth Eastern AsiaSouthern EuropeSpainSri LankaSt. Vincent and the GrenadinesSudanSwedenSwitzerlandSyriaTaiwanThailandTrinidad and TobagoTurkeyUgandaUkraineUruguayUzbekistanVenezuelaVietnamWest IndiesWestern AfricaWestern AsiaWestern EuropeYemenZaireZimbabweAzores
Married-Couple Family Poverty
Income
Poverty
Unemployment
Labor Participation
Family Structure
Vehicle Availability
Education Level
Disability

West Indian Married-Couple Family Poverty
Tragic

6.4%
POVERTY | MARRIED-COUPLE FAMILIES
0.0/ 100
METRIC RATING
280th/ 347
METRIC RANK

West Indian Married-Couple Family Poverty Correlation Chart

The statistical analysis conducted on geographies consisting of 252,794,442 people shows a mild negative correlation between the proportion of West Indians and poverty level among married-couple families in the United States with a correlation coefficient (R) of -0.325 and weighted average of 6.4%. On average, for every 1% (one percent) increase in West Indians within a typical geography, there is a decrease of 0.12% in poverty level among married-couple families.
West Indian Married-Couple Family Poverty
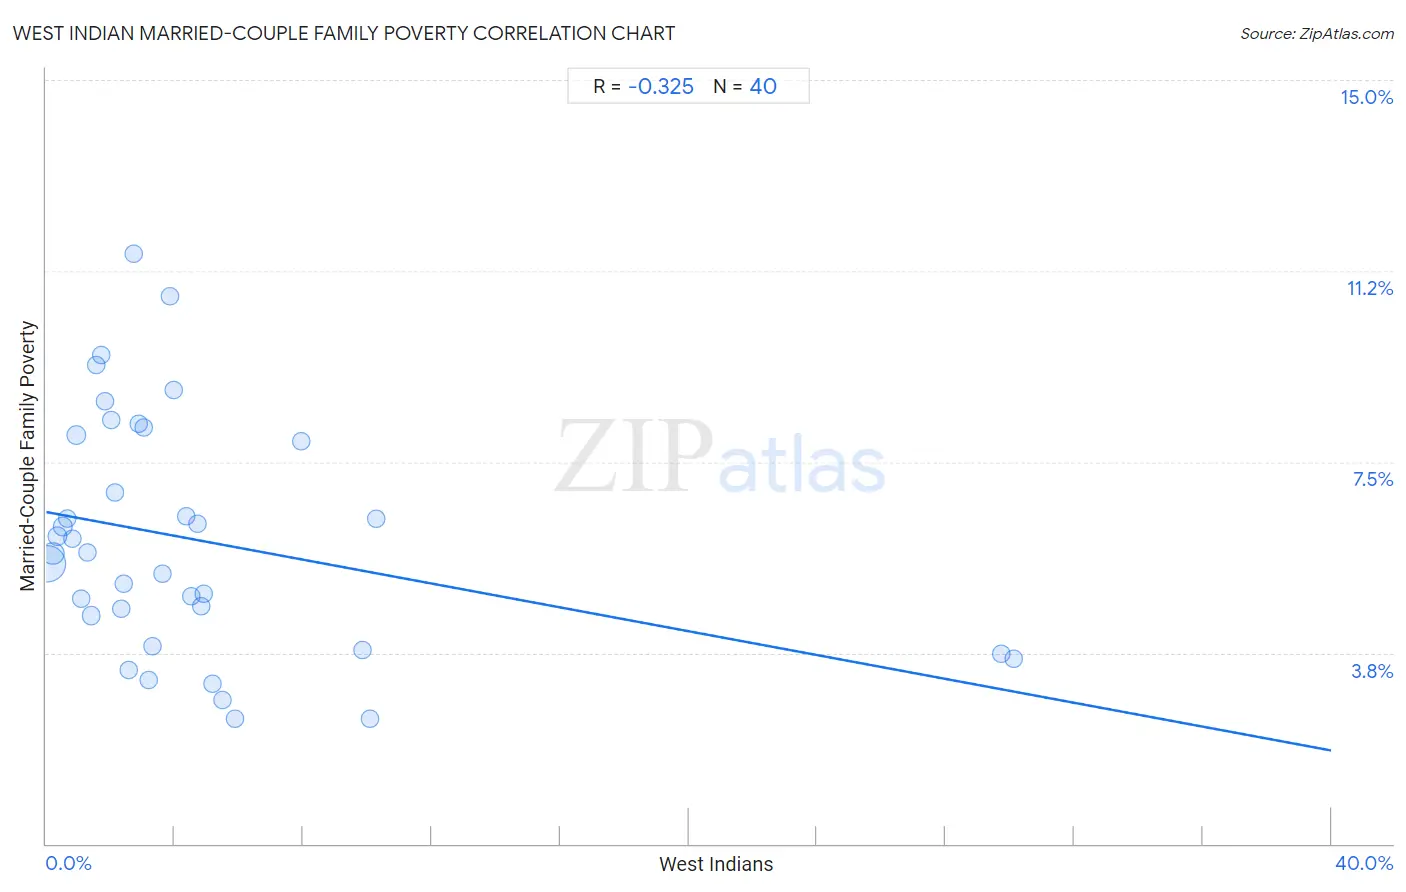
It is essential to understand that the correlation between the percentage of West Indians and poverty level among married-couple families does not imply a direct cause-and-effect relationship. It remains uncertain whether the presence of West Indians influences an upward or downward trend in the level of poverty level among married-couple families within an area, or if West Indians simply ended up residing in those areas with higher or lower levels of poverty level among married-couple families due to other factors.

Demographics Similar to West Indians by Married-Couple Family Poverty

In terms of married-couple family poverty, the demographic groups most similar to West Indians are Houma (6.4%, a difference of 0.050%), Immigrants from Trinidad and Tobago (6.4%, a difference of 0.29%), Mexican American Indian (6.4%, a difference of 0.51%), Seminole (6.4%, a difference of 0.51%), and Indonesian (6.3%, a difference of 0.78%).
DemographicsRating | RankMarried-Couple Family Poverty
Colville
0.1
/100
|
#273
Tragic
6.3%
Barbadians
0.1
/100
|
#274
Tragic
6.3%
Choctaw
0.1
/100
|
#275
Tragic
6.3%
Yaqui
0.1
/100
|
#276
Tragic
6.3%
Indonesians
0.1
/100
|
#277
Tragic
6.3%
Immigrants from Trinidad and Tobago
0.1
/100
|
#278
Tragic
6.4%
Houma
0.0
/100
|
#279
Tragic
6.4%
West Indians
0.0
/100
|
#280
Tragic
6.4%
Mexican American Indians
0.0
/100
|
#281
Tragic
6.4%
Seminole
0.0
/100
|
#282
Tragic
6.4%
Ute
0.0
/100
|
#283
Tragic
6.4%
Dutch West Indians
0.0
/100
|
#284
Tragic
6.4%
Blacks/African Americans
0.0
/100
|
#285
Tragic
6.5%
Guyanese
0.0
/100
|
#286
Tragic
6.5%
Ecuadorians
0.0
/100
|
#287
Tragic
6.5%

West Indian Married-Couple Family Poverty Correlation Summary

MeasurementWest Indian DataMarried-Couple Family Poverty Data
Minimum0.054%2.5%
Maximum30.1%11.6%
Range30.1%9.1%
Mean4.7%6.0%
Median3.0%5.7%
Interquartile 25% (IQ1)1.5%4.2%
Interquartile 75% (IQ3)4.9%8.0%
Interquartile Range (IQR)3.4%3.8%
Standard Deviation (Sample)6.4%2.3%
Standard Deviation (Population)6.3%2.3%

Correlation Details

West Indian PercentileSample SizeMarried-Couple Family Poverty
[
0.0%
-
0.5%
]
0.054%
173,259,2905.5%
[
0.0%
-
0.5%
]
0.21%
39,483,0325.7%
[
0.0%
-
0.5%
]
0.35%
12,975,2766.1%
[
0.5%
-
1.0%
]
0.51%
6,085,4366.2%
[
0.5%
-
1.0%
]
0.66%
4,018,1296.4%
[
0.5%
-
1.0%
]
0.82%
1,979,6156.0%
[
0.5%
-
1.0%
]
0.95%
10,320,0658.0%
[
1.0%
-
1.5%
]
1.09%
1,082,8994.8%
[
1.0%
-
1.5%
]
1.28%
563,9435.7%
[
1.0%
-
1.5%
]
1.41%
290,9994.5%
[
1.5%
-
2.0%
]
1.57%
402,8299.4%
[
1.5%
-
2.0%
]
1.71%
323,6099.6%
[
1.5%
-
2.0%
]
1.84%
161,4288.7%
[
2.0%
-
2.5%
]
2.02%
134,8668.3%
[
2.0%
-
2.5%
]
2.14%
191,4646.9%
[
2.0%
-
2.5%
]
2.32%
137,9124.6%
[
2.0%
-
2.5%
]
2.42%
208,2135.1%
[
2.5%
-
3.0%
]
2.59%
145,1483.4%
[
2.5%
-
3.0%
]
2.73%
286,76011.6%
[
2.5%
-
3.0%
]
2.88%
46,6118.2%
[
3.0%
-
3.5%
]
3.05%
5,3448.2%
[
3.0%
-
3.5%
]
3.19%
14,5453.2%
[
3.0%
-
3.5%
]
3.32%
189,0613.9%
[
3.5%
-
4.0%
]
3.61%
75,7255.3%
[
3.5%
-
4.0%
]
3.85%
4,64810.8%
[
3.5%
-
4.0%
]
3.98%
67,4878.9%
[
4.0%
-
4.5%
]
4.36%
8,1646.4%
[
4.5%
-
5.0%
]
4.52%
21,3494.9%
[
4.5%
-
5.0%
]
4.71%
9126.3%
[
4.5%
-
5.0%
]
4.81%
3,1814.7%
[
4.5%
-
5.0%
]
4.91%
3,1144.9%
[
5.0%
-
5.5%
]
5.17%
6,8513.1%
[
5.0%
-
5.5%
]
5.50%
32,2962.8%
[
5.5%
-
6.0%
]
5.88%
85,4252.5%
[
7.5%
-
8.0%
]
7.93%
83,1257.9%
[
9.5%
-
10.0%
]
9.85%
3,1173.8%
[
10.0%
-
10.5%
]
10.06%
10,5262.5%
[
10.0%
-
10.5%
]
10.27%
78,5066.4%
[
29.5%
-
30.0%
]
29.74%
1,7823.7%
[
30.0%
-
30.5%
]
30.11%
1,7603.6%