Sudanese Married-Couple Family Poverty
COMPARE
Sudanese
Select to Compare
Married-Couple Family Poverty
Sudanese Married-Couple Family Poverty
5.6%
POVERTY | MARRIED-COUPLE FAMILIES
6.4/ 100
METRIC RATING
224th/ 347
METRIC RANK
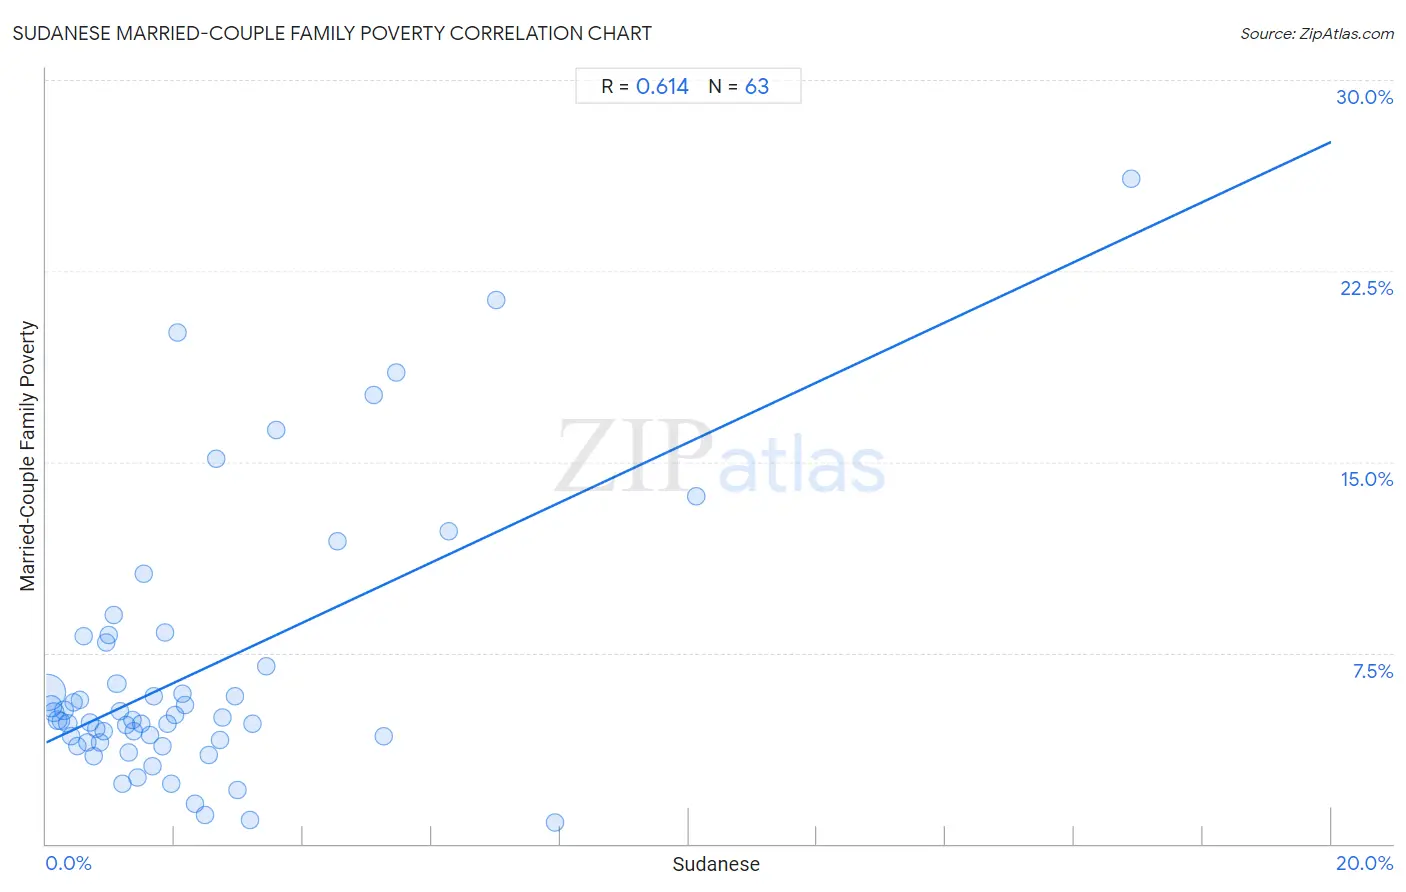
Sudanese Married-Couple Family Poverty Correlation Chart
The statistical analysis conducted on geographies consisting of 109,883,961 people shows a significant positive correlation between the proportion of Sudanese and poverty level among married-couple families in the United States with a correlation coefficient (R) of 0.614 and weighted average of 5.6%. On average, for every 1% (one percent) increase in Sudanese within a typical geography, there is an increase of 1.2% in poverty level among married-couple families.
It is essential to understand that the correlation between the percentage of Sudanese and poverty level among married-couple families does not imply a direct cause-and-effect relationship. It remains uncertain whether the presence of Sudanese influences an upward or downward trend in the level of poverty level among married-couple families within an area, or if Sudanese simply ended up residing in those areas with higher or lower levels of poverty level among married-couple families due to other factors.
Demographics Similar to Sudanese by Married-Couple Family Poverty
In terms of married-couple family poverty, the demographic groups most similar to Sudanese are Immigrants from Fiji (5.6%, a difference of 0.11%), Immigrants from Cambodia (5.6%, a difference of 0.14%), Cajun (5.6%, a difference of 0.18%), South American (5.6%, a difference of 0.37%), and Immigrants from Zaire (5.6%, a difference of 0.38%).
| Demographics | Rating | Rank | Married-Couple Family Poverty |
| Immigrants from Nigeria | 11.3 /100 | #217 | Poor 5.5% |
| Afghans | 11.2 /100 | #218 | Poor 5.5% |
| Japanese | 9.8 /100 | #219 | Tragic 5.6% |
| Colombians | 9.2 /100 | #220 | Tragic 5.6% |
| Panamanians | 9.2 /100 | #221 | Tragic 5.6% |
| Cajuns | 6.9 /100 | #222 | Tragic 5.6% |
| Immigrants from Fiji | 6.7 /100 | #223 | Tragic 5.6% |
| Sudanese | 6.4 /100 | #224 | Tragic 5.6% |
| Immigrants from Cambodia | 6.1 /100 | #225 | Tragic 5.6% |
| South Americans | 5.7 /100 | #226 | Tragic 5.6% |
| Immigrants from Zaire | 5.6 /100 | #227 | Tragic 5.6% |
| Arabs | 5.4 /100 | #228 | Tragic 5.7% |
| Sub-Saharan Africans | 4.9 /100 | #229 | Tragic 5.7% |
| Moroccans | 4.9 /100 | #230 | Tragic 5.7% |
| Immigrants from Iraq | 4.4 /100 | #231 | Tragic 5.7% |
Sudanese Married-Couple Family Poverty Correlation Summary
| Measurement | Sudanese Data | Married-Couple Family Poverty Data |
| Minimum | 0.020% | 0.84% |
| Maximum | 16.9% | 26.1% |
| Range | 16.9% | 25.3% |
| Mean | 2.4% | 6.8% |
| Median | 1.6% | 4.9% |
| Interquartile 25% (IQ1) | 0.78% | 4.0% |
| Interquartile 75% (IQ3) | 2.7% | 7.9% |
| Interquartile Range (IQR) | 2.0% | 3.9% |
| Standard Deviation (Sample) | 2.7% | 5.2% |
| Standard Deviation (Population) | 2.7% | 5.2% |
Correlation Details
| Sudanese Percentile | Sample Size | Married-Couple Family Poverty |
[ 0.0% - 0.5% ] 0.020% | 68,858,672 | 5.9% |
[ 0.0% - 0.5% ] 0.075% | 13,816,876 | 5.4% |
[ 0.0% - 0.5% ] 0.13% | 7,039,416 | 5.2% |
[ 0.0% - 0.5% ] 0.18% | 3,618,971 | 4.8% |
[ 0.0% - 0.5% ] 0.22% | 2,480,983 | 4.8% |
[ 0.0% - 0.5% ] 0.28% | 2,203,584 | 5.2% |
[ 0.0% - 0.5% ] 0.33% | 2,737,819 | 4.7% |
[ 0.0% - 0.5% ] 0.38% | 886,482 | 4.2% |
[ 0.0% - 0.5% ] 0.43% | 1,058,255 | 5.6% |
[ 0.0% - 0.5% ] 0.48% | 973,619 | 3.8% |
[ 0.5% - 1.0% ] 0.53% | 1,002,090 | 5.7% |
[ 0.5% - 1.0% ] 0.58% | 523,271 | 8.1% |
[ 0.5% - 1.0% ] 0.65% | 829,757 | 4.0% |
[ 0.5% - 1.0% ] 0.68% | 327,261 | 4.8% |
[ 0.5% - 1.0% ] 0.73% | 394,831 | 3.5% |
[ 0.5% - 1.0% ] 0.78% | 194,664 | 4.5% |
[ 0.5% - 1.0% ] 0.83% | 276,347 | 4.0% |
[ 0.5% - 1.0% ] 0.89% | 229,406 | 4.4% |
[ 0.5% - 1.0% ] 0.93% | 214,821 | 7.9% |
[ 0.5% - 1.0% ] 0.98% | 105,043 | 8.2% |
[ 1.0% - 1.5% ] 1.05% | 204,808 | 9.0% |
[ 1.0% - 1.5% ] 1.10% | 360,967 | 6.3% |
[ 1.0% - 1.5% ] 1.15% | 88,402 | 5.2% |
[ 1.0% - 1.5% ] 1.19% | 47,024 | 2.4% |
[ 1.0% - 1.5% ] 1.24% | 84,796 | 4.7% |
[ 1.0% - 1.5% ] 1.29% | 113,562 | 3.6% |
[ 1.0% - 1.5% ] 1.33% | 263,517 | 4.9% |
[ 1.0% - 1.5% ] 1.37% | 58,210 | 4.4% |
[ 1.0% - 1.5% ] 1.42% | 24,018 | 2.6% |
[ 1.0% - 1.5% ] 1.47% | 44,756 | 4.7% |
[ 1.5% - 2.0% ] 1.52% | 39,237 | 10.6% |
[ 1.5% - 2.0% ] 1.61% | 6,278 | 4.3% |
[ 1.5% - 2.0% ] 1.66% | 8,608 | 3.0% |
[ 1.5% - 2.0% ] 1.68% | 35,223 | 5.8% |
[ 1.5% - 2.0% ] 1.82% | 119,866 | 3.8% |
[ 1.5% - 2.0% ] 1.84% | 21,801 | 8.3% |
[ 1.5% - 2.0% ] 1.89% | 52,472 | 4.7% |
[ 1.5% - 2.0% ] 1.94% | 12,595 | 2.3% |
[ 2.0% - 2.5% ] 2.01% | 29,580 | 5.1% |
[ 2.0% - 2.5% ] 2.04% | 33,194 | 20.1% |
[ 2.0% - 2.5% ] 2.12% | 80,568 | 5.9% |
[ 2.0% - 2.5% ] 2.16% | 43,183 | 5.5% |
[ 2.0% - 2.5% ] 2.31% | 29,261 | 1.5% |
[ 2.0% - 2.5% ] 2.47% | 51,386 | 1.1% |
[ 2.5% - 3.0% ] 2.54% | 8,283 | 3.5% |
[ 2.5% - 3.0% ] 2.64% | 13,087 | 15.1% |
[ 2.5% - 3.0% ] 2.71% | 66,249 | 4.1% |
[ 2.5% - 3.0% ] 2.74% | 8,259 | 5.0% |
[ 2.5% - 3.0% ] 2.93% | 25,129 | 5.8% |
[ 2.5% - 3.0% ] 2.97% | 21,583 | 2.1% |
[ 3.0% - 3.5% ] 3.17% | 3,093 | 0.95% |
[ 3.0% - 3.5% ] 3.22% | 31,976 | 4.7% |
[ 3.0% - 3.5% ] 3.42% | 1,082 | 7.0% |
[ 3.5% - 4.0% ] 3.58% | 3,440 | 16.2% |
[ 4.5% - 5.0% ] 4.53% | 22,340 | 11.9% |
[ 5.0% - 5.5% ] 5.10% | 24,028 | 17.6% |
[ 5.0% - 5.5% ] 5.26% | 2,586 | 4.2% |
[ 5.0% - 5.5% ] 5.45% | 9,681 | 18.5% |
[ 6.0% - 6.5% ] 6.27% | 590 | 12.3% |
[ 7.0% - 7.5% ] 7.01% | 10,086 | 21.3% |
[ 7.5% - 8.0% ] 7.92% | 2,727 | 0.84% |
[ 10.0% - 10.5% ] 10.12% | 1,206 | 13.6% |
[ 16.5% - 17.0% ] 16.88% | 3,056 | 26.1% |