Danish Married-Couple Family Poverty

COMPARE

Danish
Race
Ancestry
AfghanAfricanAlaska NativeAlaskan AthabascanAlbanianAleutAlsatianAmericanApacheArabArapahoArgentineanArmenianAssyrian/Chaldean/SyriacAustralianAustrianBahamianBangladeshiBarbadianBasqueBelgianBelizeanBermudanBhutaneseBlackfeetBolivianBrazilianBritishBritish West IndianBulgarianBurmeseCajunCambodianCanadianCape VerdeanCarpatho RusynCelticCentral AmericanCentral American IndianCherokeeCheyenneChickasawChileanChineseChippewaChoctawColombianColvilleComancheCosta RicanCreeCreekCroatianCrowCubanCypriotCzechCzechoslovakianDanishDelawareDominicanDutchDutch West IndianEastern EuropeanEcuadorianEgyptianEnglishEstonianEthiopianEuropeanFijianFilipinoFinnishFrenchFrench American IndianFrench CanadianGermanGerman RussianGhanaianGreekGuamanian/ChamorroGuatemalanGuyaneseHaitianHmongHonduranHopiHoumaHungarianIcelanderIndian (Asian)IndonesianInupiatIranianIraqiIrishIroquoisIsraeliItalianJamaicanJapaneseJordanianKenyanKiowaKoreanLaotianLatvianLebaneseLiberianLithuanianLumbeeLuxembourgerMacedonianMalaysianMalteseMarshalleseMenomineeMexicanMexican American IndianMongolianMoroccanNative HawaiianNavajoNepaleseNew ZealanderNicaraguanNigerianNorthern EuropeanNorwegianOkinawanOsageOttawaPaiutePakistaniPalestinianPanamanianParaguayanPennsylvania GermanPeruvianPimaPolishPortuguesePotawatomiPuebloPuerto RicanPuget Sound SalishRomanianRussianSalvadoranSamoanScandinavianScotch-IrishScottishSeminoleSenegaleseSerbianShoshoneSierra LeoneanSiouxSlavicSlovakSloveneSomaliSouth AfricanSouth AmericanSouth American IndianSoviet UnionSpaniardSpanishSpanish AmericanSpanish American IndianSri LankanSubsaharan AfricanSudaneseSwedishSwissSyrianTaiwaneseThaiTlingit-HaidaTohono O'OdhamTonganTrinidadian and TobagonianTsimshianTurkishU.S. Virgin IslanderUgandanUkrainianUruguayanUteVenezuelanVietnameseWelshWest IndianYakamaYaquiYugoslavianYumanYup'ikZimbabwean
Immigration
NonimmigrantsImmigrantsAfghanistanAfricaAlbaniaArgentinaArmeniaAsiaAustraliaAustriaBahamasBangladeshBarbadosBelarusBelgiumBelizeBoliviaBosnia and HerzegovinaBrazilBulgariaBurma/MyanmarCabo VerdeCambodiaCameroonCanadaCaribbeanCentral AmericaChileChinaColombiaCongoCosta RicaCroatiaCubaCzechoslovakiaDenmarkDominicaDominican RepublicEastern AfricaEastern AsiaEastern EuropeEcuadorEgyptEl SalvadorEnglandEritreaEthiopiaEuropeFijiFranceGermanyGhanaGreeceGrenadaGuatemalaGuyanaHaitiHondurasHong KongHungaryIndiaIndonesiaIranIraqIrelandIsraelItalyJamaicaJapanJordanKazakhstanKenyaKoreaKuwaitLaosLatin AmericaLatviaLebanonLiberiaLithuaniaMalaysiaMexicoMicronesiaMiddle AfricaMoldovaMoroccoNepalNetherlandsNicaraguaNigeriaNorth AmericaNorth MacedoniaNorthern AfricaNorthern EuropeNorwayOceaniaPakistanPanamaPeruPhilippinesPolandPortugalRomaniaRussiaSaudi ArabiaScotlandSenegalSerbiaSierra LeoneSingaporeSomaliaSouth AfricaSouth AmericaSouth Central AsiaSouth Eastern AsiaSouthern EuropeSpainSri LankaSt. Vincent and the GrenadinesSudanSwedenSwitzerlandSyriaTaiwanThailandTrinidad and TobagoTurkeyUgandaUkraineUruguayUzbekistanVenezuelaVietnamWest IndiesWestern AfricaWestern AsiaWestern EuropeYemenZaireZimbabweAzores
Select to Compare
Race
Ancestry
AfghanAfricanAlaska NativeAlaskan AthabascanAlbanianAleutAlsatianAmericanApacheArabArapahoArgentineanArmenianAssyrian/Chaldean/SyriacAustralianAustrianBahamianBangladeshiBarbadianBasqueBelgianBelizeanBermudanBhutaneseBlackfeetBolivianBrazilianBritishBritish West IndianBulgarianBurmeseCajunCambodianCanadianCape VerdeanCarpatho RusynCelticCentral AmericanCentral American IndianCherokeeCheyenneChickasawChileanChineseChippewaChoctawColombianColvilleComancheCosta RicanCreeCreekCroatianCrowCubanCypriotCzechCzechoslovakianDelawareDominicanDutchDutch West IndianEastern EuropeanEcuadorianEgyptianEnglishEstonianEthiopianEuropeanFijianFilipinoFinnishFrenchFrench American IndianFrench CanadianGermanGerman RussianGhanaianGreekGuamanian/ChamorroGuatemalanGuyaneseHaitianHmongHonduranHopiHoumaHungarianIcelanderIndian (Asian)IndonesianInupiatIranianIraqiIrishIroquoisIsraeliItalianJamaicanJapaneseJordanianKenyanKiowaKoreanLaotianLatvianLebaneseLiberianLithuanianLumbeeLuxembourgerMacedonianMalaysianMalteseMarshalleseMenomineeMexicanMexican American IndianMongolianMoroccanNative HawaiianNavajoNepaleseNew ZealanderNicaraguanNigerianNorthern EuropeanNorwegianOkinawanOsageOttawaPaiutePakistaniPalestinianPanamanianParaguayanPennsylvania GermanPeruvianPimaPolishPortuguesePotawatomiPuebloPuerto RicanPuget Sound SalishRomanianRussianSalvadoranSamoanScandinavianScotch-IrishScottishSeminoleSenegaleseSerbianShoshoneSierra LeoneanSiouxSlavicSlovakSloveneSomaliSouth AfricanSouth AmericanSouth American IndianSoviet UnionSpaniardSpanishSpanish AmericanSpanish American IndianSri LankanSubsaharan AfricanSudaneseSwedishSwissSyrianTaiwaneseThaiTlingit-HaidaTohono O'OdhamTonganTrinidadian and TobagonianTsimshianTurkishU.S. Virgin IslanderUgandanUkrainianUruguayanUteVenezuelanVietnameseWelshWest IndianYakamaYaquiYugoslavianYumanYup'ikZimbabwean
Immigration
NonimmigrantsImmigrantsAfghanistanAfricaAlbaniaArgentinaArmeniaAsiaAustraliaAustriaBahamasBangladeshBarbadosBelarusBelgiumBelizeBoliviaBosnia and HerzegovinaBrazilBulgariaBurma/MyanmarCabo VerdeCambodiaCameroonCanadaCaribbeanCentral AmericaChileChinaColombiaCongoCosta RicaCroatiaCubaCzechoslovakiaDenmarkDominicaDominican RepublicEastern AfricaEastern AsiaEastern EuropeEcuadorEgyptEl SalvadorEnglandEritreaEthiopiaEuropeFijiFranceGermanyGhanaGreeceGrenadaGuatemalaGuyanaHaitiHondurasHong KongHungaryIndiaIndonesiaIranIraqIrelandIsraelItalyJamaicaJapanJordanKazakhstanKenyaKoreaKuwaitLaosLatin AmericaLatviaLebanonLiberiaLithuaniaMalaysiaMexicoMicronesiaMiddle AfricaMoldovaMoroccoNepalNetherlandsNicaraguaNigeriaNorth AmericaNorth MacedoniaNorthern AfricaNorthern EuropeNorwayOceaniaPakistanPanamaPeruPhilippinesPolandPortugalRomaniaRussiaSaudi ArabiaScotlandSenegalSerbiaSierra LeoneSingaporeSomaliaSouth AfricaSouth AmericaSouth Central AsiaSouth Eastern AsiaSouthern EuropeSpainSri LankaSt. Vincent and the GrenadinesSudanSwedenSwitzerlandSyriaTaiwanThailandTrinidad and TobagoTurkeyUgandaUkraineUruguayUzbekistanVenezuelaVietnamWest IndiesWestern AfricaWestern AsiaWestern EuropeYemenZaireZimbabweAzores
Married-Couple Family Poverty
Income
Poverty
Unemployment
Labor Participation
Family Structure
Vehicle Availability
Education Level
Disability

Danish Married-Couple Family Poverty
Exceptional

4.1%
POVERTY | MARRIED-COUPLE FAMILIES
99.9/ 100
METRIC RATING
27th/ 347
METRIC RANK

Danish Married-Couple Family Poverty Correlation Chart

The statistical analysis conducted on geographies consisting of 466,536,369 people shows a substantial positive correlation between the proportion of Danes and poverty level among married-couple families in the United States with a correlation coefficient (R) of 0.510 and weighted average of 4.1%. On average, for every 1% (one percent) increase in Danes within a typical geography, there is an increase of 0.36% in poverty level among married-couple families.
Danish Married-Couple Family Poverty
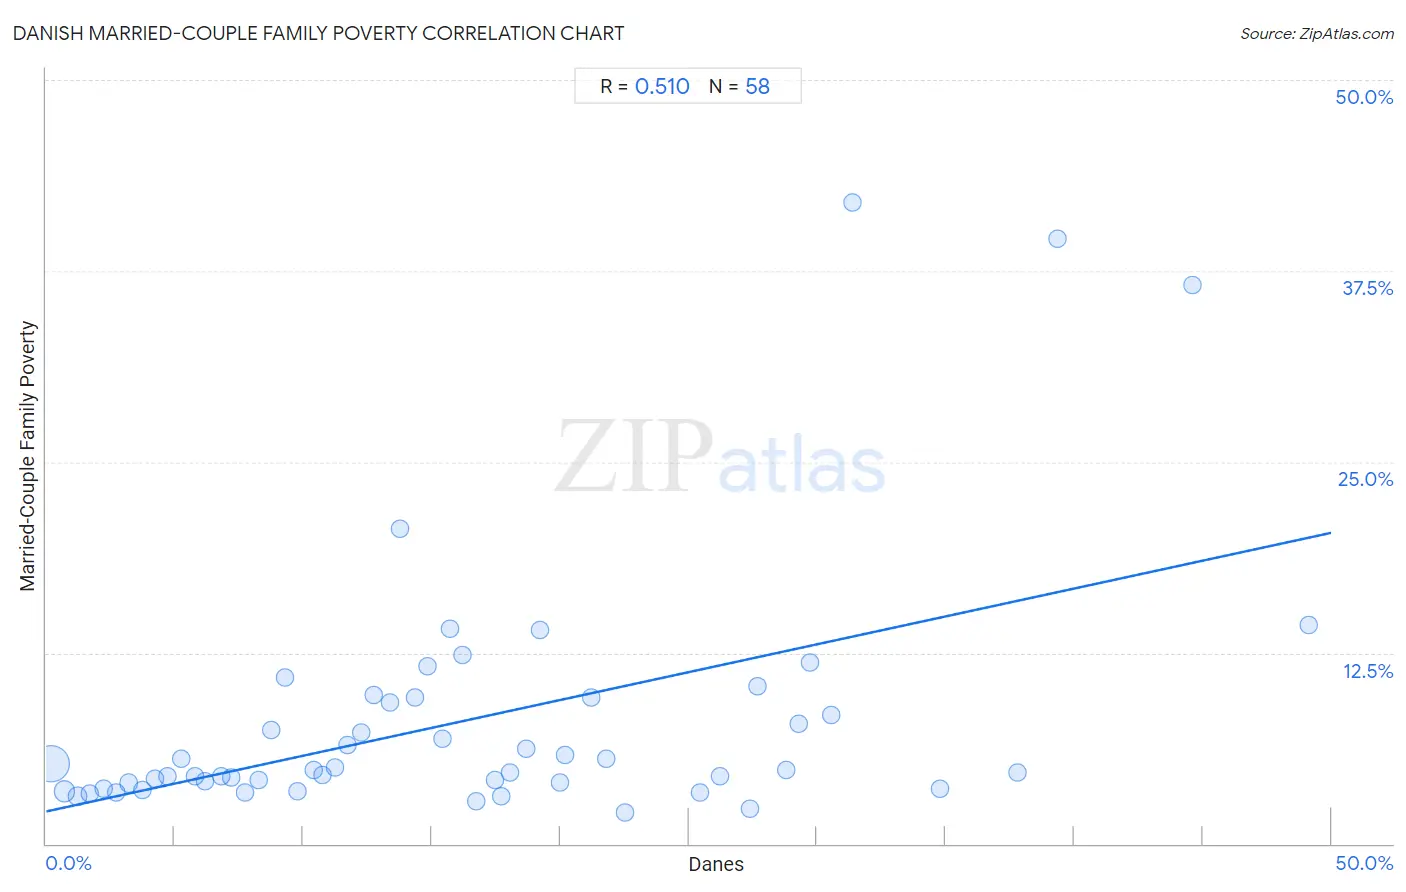
It is essential to understand that the correlation between the percentage of Danes and poverty level among married-couple families does not imply a direct cause-and-effect relationship. It remains uncertain whether the presence of Danes influences an upward or downward trend in the level of poverty level among married-couple families within an area, or if Danes simply ended up residing in those areas with higher or lower levels of poverty level among married-couple families due to other factors.

Demographics Similar to Danes by Married-Couple Family Poverty

In terms of married-couple family poverty, the demographic groups most similar to Danes are Cypriot (4.1%, a difference of 0.11%), Scandinavian (4.1%, a difference of 0.11%), Immigrants from Scotland (4.2%, a difference of 0.15%), Immigrants from Taiwan (4.1%, a difference of 0.38%), and Finnish (4.2%, a difference of 0.39%).
DemographicsRating | RankMarried-Couple Family Poverty
Maltese
99.9
/100
|
#20
Exceptional
4.1%
Zimbabweans
99.9
/100
|
#21
Exceptional
4.1%
Immigrants from Singapore
99.9
/100
|
#22
Exceptional
4.1%
Bhutanese
99.9
/100
|
#23
Exceptional
4.1%
Eastern Europeans
99.9
/100
|
#24
Exceptional
4.1%
Immigrants from Taiwan
99.9
/100
|
#25
Exceptional
4.1%
Cypriots
99.9
/100
|
#26
Exceptional
4.1%
Danes
99.9
/100
|
#27
Exceptional
4.1%
Scandinavians
99.9
/100
|
#28
Exceptional
4.1%
Immigrants from Scotland
99.9
/100
|
#29
Exceptional
4.2%
Finns
99.9
/100
|
#30
Exceptional
4.2%
Estonians
99.9
/100
|
#31
Exceptional
4.2%
Greeks
99.9
/100
|
#32
Exceptional
4.2%
Irish
99.9
/100
|
#33
Exceptional
4.2%
Dutch
99.9
/100
|
#34
Exceptional
4.2%

Danish Married-Couple Family Poverty Correlation Summary

MeasurementDanish DataMarried-Couple Family Poverty Data
Minimum0.19%2.0%
Maximum49.1%42.0%
Range48.9%40.0%
Mean16.3%8.1%
Median14.6%4.8%
Interquartile 25% (IQ1)7.2%4.0%
Interquartile 75% (IQ3)22.5%9.5%
Interquartile Range (IQR)15.3%5.6%
Standard Deviation (Sample)11.6%8.3%
Standard Deviation (Population)11.5%8.2%

Correlation Details

Danish PercentileSample SizeMarried-Couple Family Poverty
[
0.0%
-
0.5%
]
0.19%
353,488,2185.2%
[
0.5%
-
1.0%
]
0.71%
68,441,9093.4%
[
1.0%
-
1.5%
]
1.20%
23,794,6563.1%
[
1.5%
-
2.0%
]
1.70%
8,609,2093.3%
[
2.0%
-
2.5%
]
2.24%
2,965,2283.6%
[
2.5%
-
3.0%
]
2.74%
1,867,9363.3%
[
3.0%
-
3.5%
]
3.22%
1,405,4064.0%
[
3.5%
-
4.0%
]
3.75%
1,613,3803.5%
[
4.0%
-
4.5%
]
4.21%
1,122,6534.3%
[
4.5%
-
5.0%
]
4.73%
920,1754.4%
[
5.0%
-
5.5%
]
5.28%
757,4855.6%
[
5.5%
-
6.0%
]
5.78%
440,1704.4%
[
6.0%
-
6.5%
]
6.18%
243,8634.1%
[
6.5%
-
7.0%
]
6.81%
176,5374.4%
[
7.0%
-
7.5%
]
7.22%
125,7304.3%
[
7.5%
-
8.0%
]
7.73%
190,5233.4%
[
8.0%
-
8.5%
]
8.28%
99,8404.2%
[
8.5%
-
9.0%
]
8.77%
52,8467.5%
[
9.0%
-
9.5%
]
9.28%
18,95010.9%
[
9.5%
-
10.0%
]
9.79%
29,7623.4%
[
10.0%
-
10.5%
]
10.41%
14,3704.8%
[
10.5%
-
11.0%
]
10.76%
26,3764.5%
[
11.0%
-
11.5%
]
11.23%
20,9355.0%
[
11.5%
-
12.0%
]
11.72%
6,4506.5%
[
12.0%
-
12.5%
]
12.26%
2,8547.3%
[
12.5%
-
13.0%
]
12.73%
14,2159.8%
[
13.0%
-
13.5%
]
13.40%
13,7049.3%
[
13.5%
-
14.0%
]
13.77%
7,89220.6%
[
14.0%
-
14.5%
]
14.35%
9,4719.5%
[
14.5%
-
15.0%
]
14.86%
2,65911.7%
[
15.0%
-
15.5%
]
15.40%
1,5526.9%
[
15.5%
-
16.0%
]
15.71%
2,25914.1%
[
16.0%
-
16.5%
]
16.20%
1,66712.3%
[
16.5%
-
17.0%
]
16.74%
3,5302.8%
[
17.0%
-
17.5%
]
17.44%
8,7024.2%
[
17.5%
-
18.0%
]
17.68%
2,3813.1%
[
18.0%
-
18.5%
]
18.05%
7704.6%
[
18.5%
-
19.0%
]
18.68%
2,2656.2%
[
19.0%
-
19.5%
]
19.21%
4,41414.0%
[
20.0%
-
20.5%
]
20.00%
1,1004.0%
[
20.0%
-
20.5%
]
20.20%
3,7085.8%
[
21.0%
-
21.5%
]
21.19%
2,8839.6%
[
21.5%
-
22.0%
]
21.78%
4,3255.6%
[
22.5%
-
23.0%
]
22.52%
2222.0%
[
25.0%
-
25.5%
]
25.43%
2,9373.4%
[
26.0%
-
26.5%
]
26.22%
2,0484.4%
[
27.0%
-
27.5%
]
27.36%
7932.3%
[
27.5%
-
28.0%
]
27.66%
14110.3%
[
28.5%
-
29.0%
]
28.78%
2,9464.8%
[
29.0%
-
29.5%
]
29.27%
3287.9%
[
29.5%
-
30.0%
]
29.72%
1,43011.9%
[
30.5%
-
31.0%
]
30.53%
4168.4%
[
31.0%
-
31.5%
]
31.37%
20442.0%
[
34.5%
-
35.0%
]
34.79%
8913.6%
[
37.5%
-
38.0%
]
37.80%
7464.7%
[
39.0%
-
39.5%
]
39.33%
17839.6%
[
44.5%
-
45.0%
]
44.59%
7436.6%
[
49.0%
-
49.5%
]
49.12%
5714.3%