Chinese Married-Couple Family Poverty
COMPARE
Chinese
Select to Compare
Married-Couple Family Poverty
Chinese Married-Couple Family Poverty
3.6%
POVERTY | MARRIED-COUPLE FAMILIES
100.0/ 100
METRIC RATING
2nd/ 347
METRIC RANK
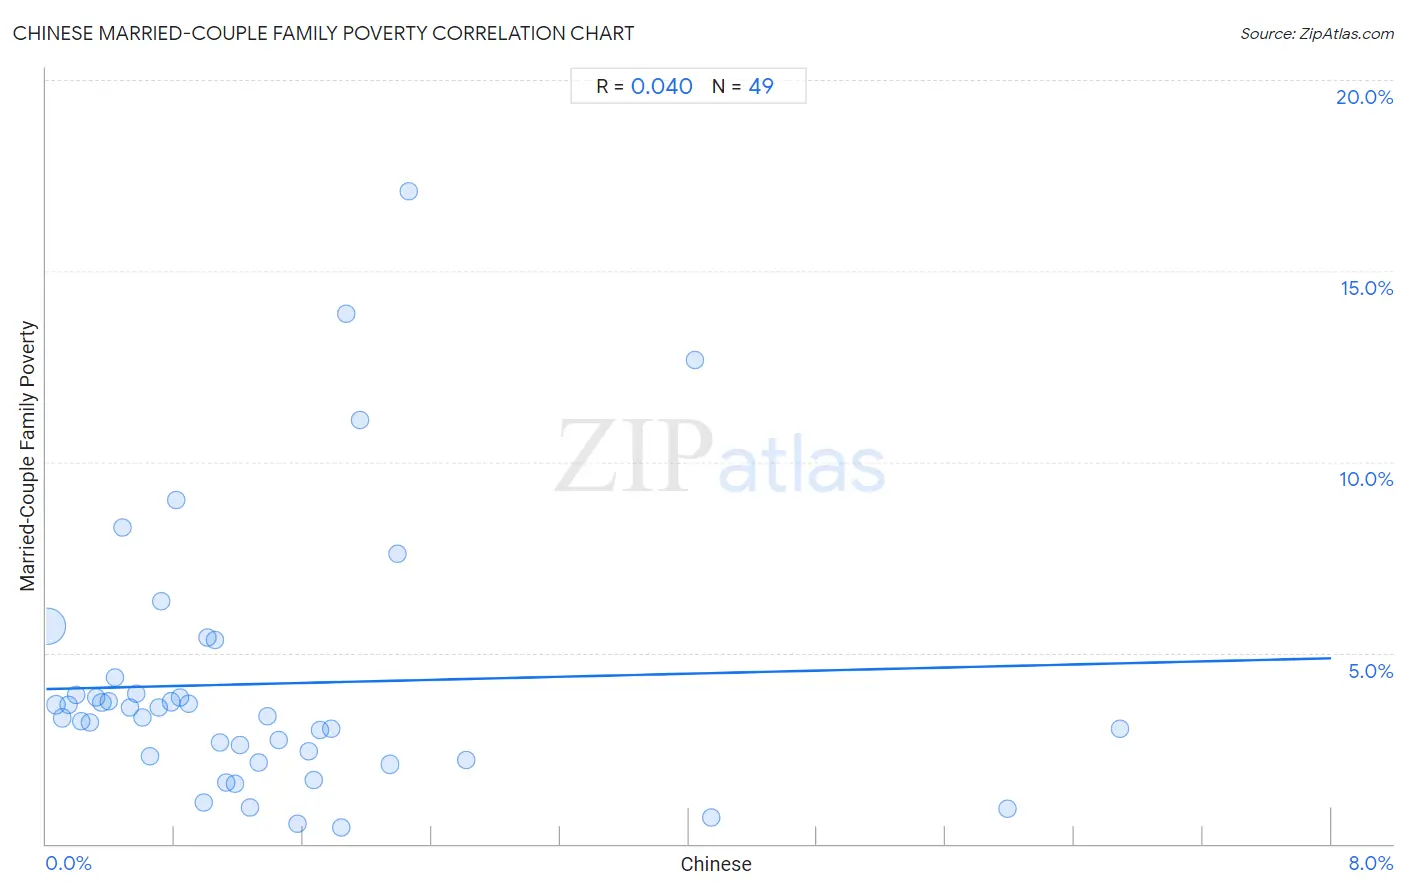
Chinese Married-Couple Family Poverty Correlation Chart
The statistical analysis conducted on geographies consisting of 64,670,469 people shows no correlation between the proportion of Chinese and poverty level among married-couple families in the United States with a correlation coefficient (R) of 0.040 and weighted average of 3.6%. On average, for every 1% (one percent) increase in Chinese within a typical geography, there is an increase of 0.10% in poverty level among married-couple families.
It is essential to understand that the correlation between the percentage of Chinese and poverty level among married-couple families does not imply a direct cause-and-effect relationship. It remains uncertain whether the presence of Chinese influences an upward or downward trend in the level of poverty level among married-couple families within an area, or if Chinese simply ended up residing in those areas with higher or lower levels of poverty level among married-couple families due to other factors.
Demographics Similar to Chinese by Married-Couple Family Poverty
In terms of married-couple family poverty, the demographic groups most similar to Chinese are Immigrants from India (3.6%, a difference of 0.18%), Norwegian (3.7%, a difference of 1.9%), Slovene (3.8%, a difference of 5.6%), Swedish (3.9%, a difference of 5.7%), and Luxembourger (3.9%, a difference of 6.4%).
| Demographics | Rating | Rank | Married-Couple Family Poverty |
| Immigrants from India | 100.0 /100 | #1 | Exceptional 3.6% |
| Chinese | 100.0 /100 | #2 | Exceptional 3.6% |
| Norwegians | 100.0 /100 | #3 | Exceptional 3.7% |
| Slovenes | 100.0 /100 | #4 | Exceptional 3.8% |
| Swedes | 100.0 /100 | #5 | Exceptional 3.9% |
| Luxembourgers | 100.0 /100 | #6 | Exceptional 3.9% |
| Latvians | 100.0 /100 | #7 | Exceptional 3.9% |
| Thais | 100.0 /100 | #8 | Exceptional 3.9% |
| Croatians | 100.0 /100 | #9 | Exceptional 3.9% |
| Carpatho Rusyns | 100.0 /100 | #10 | Exceptional 3.9% |
| Lithuanians | 100.0 /100 | #11 | Exceptional 4.0% |
| Bulgarians | 100.0 /100 | #12 | Exceptional 4.0% |
| Czechs | 100.0 /100 | #13 | Exceptional 4.0% |
| Slovaks | 100.0 /100 | #14 | Exceptional 4.0% |
| Poles | 100.0 /100 | #15 | Exceptional 4.0% |
Chinese Married-Couple Family Poverty Correlation Summary
| Measurement | Chinese Data | Married-Couple Family Poverty Data |
| Minimum | 0.0087% | 0.44% |
| Maximum | 6.7% | 17.1% |
| Range | 6.7% | 16.7% |
| Mean | 1.4% | 4.2% |
| Median | 1.1% | 3.3% |
| Interquartile 25% (IQ1) | 0.50% | 2.2% |
| Interquartile 75% (IQ3) | 1.7% | 4.1% |
| Interquartile Range (IQR) | 1.2% | 1.9% |
| Standard Deviation (Sample) | 1.4% | 3.4% |
| Standard Deviation (Population) | 1.4% | 3.4% |
Correlation Details
| Chinese Percentile | Sample Size | Married-Couple Family Poverty |
[ 0.0% - 0.5% ] 0.0087% | 53,055,746 | 5.7% |
[ 0.0% - 0.5% ] 0.059% | 5,041,697 | 3.6% |
[ 0.0% - 0.5% ] 0.10% | 1,538,210 | 3.3% |
[ 0.0% - 0.5% ] 0.14% | 1,129,828 | 3.6% |
[ 0.0% - 0.5% ] 0.19% | 517,909 | 3.9% |
[ 0.0% - 0.5% ] 0.22% | 242,519 | 3.2% |
[ 0.0% - 0.5% ] 0.27% | 241,739 | 3.2% |
[ 0.0% - 0.5% ] 0.31% | 259,017 | 3.8% |
[ 0.0% - 0.5% ] 0.35% | 167,832 | 3.7% |
[ 0.0% - 0.5% ] 0.39% | 98,584 | 3.7% |
[ 0.0% - 0.5% ] 0.43% | 144,779 | 4.3% |
[ 0.0% - 0.5% ] 0.47% | 60,363 | 8.3% |
[ 0.5% - 1.0% ] 0.52% | 115,518 | 3.6% |
[ 0.5% - 1.0% ] 0.56% | 79,978 | 3.9% |
[ 0.5% - 1.0% ] 0.60% | 263,904 | 3.3% |
[ 0.5% - 1.0% ] 0.65% | 102,015 | 2.3% |
[ 0.5% - 1.0% ] 0.70% | 110,930 | 3.6% |
[ 0.5% - 1.0% ] 0.72% | 80,366 | 6.4% |
[ 0.5% - 1.0% ] 0.78% | 454,777 | 3.7% |
[ 0.5% - 1.0% ] 0.81% | 986 | 9.0% |
[ 0.5% - 1.0% ] 0.84% | 151,355 | 3.8% |
[ 0.5% - 1.0% ] 0.89% | 78,354 | 3.7% |
[ 0.5% - 1.0% ] 0.98% | 40,323 | 1.1% |
[ 1.0% - 1.5% ] 1.00% | 50,280 | 5.4% |
[ 1.0% - 1.5% ] 1.05% | 13,292 | 5.3% |
[ 1.0% - 1.5% ] 1.09% | 38,054 | 2.6% |
[ 1.0% - 1.5% ] 1.12% | 21,546 | 1.6% |
[ 1.0% - 1.5% ] 1.18% | 24,765 | 1.6% |
[ 1.0% - 1.5% ] 1.21% | 77,415 | 2.6% |
[ 1.0% - 1.5% ] 1.27% | 54,362 | 0.94% |
[ 1.0% - 1.5% ] 1.33% | 25,957 | 2.1% |
[ 1.0% - 1.5% ] 1.37% | 11,138 | 3.3% |
[ 1.0% - 1.5% ] 1.44% | 49,512 | 2.7% |
[ 1.5% - 2.0% ] 1.57% | 27,423 | 0.54% |
[ 1.5% - 2.0% ] 1.63% | 45,392 | 2.4% |
[ 1.5% - 2.0% ] 1.67% | 48,494 | 1.7% |
[ 1.5% - 2.0% ] 1.70% | 18,802 | 3.0% |
[ 1.5% - 2.0% ] 1.77% | 35,493 | 3.0% |
[ 1.5% - 2.0% ] 1.84% | 41,560 | 0.44% |
[ 1.5% - 2.0% ] 1.87% | 10,801 | 13.9% |
[ 1.5% - 2.0% ] 1.95% | 8,543 | 11.1% |
[ 2.0% - 2.5% ] 2.14% | 63,439 | 2.1% |
[ 2.0% - 2.5% ] 2.19% | 1,555 | 7.6% |
[ 2.0% - 2.5% ] 2.26% | 1,507 | 17.1% |
[ 2.5% - 3.0% ] 2.61% | 4,786 | 2.2% |
[ 4.0% - 4.5% ] 4.04% | 4,135 | 12.7% |
[ 4.0% - 4.5% ] 4.14% | 9,571 | 0.70% |
[ 5.5% - 6.0% ] 5.98% | 5,065 | 0.91% |
[ 6.5% - 7.0% ] 6.68% | 853 | 3.0% |