Austrian Married-Couple Family Poverty
COMPARE
Austrian
Select to Compare
Married-Couple Family Poverty
Austrian Married-Couple Family Poverty
4.3%
POVERTY | MARRIED-COUPLE FAMILIES
99.7/ 100
METRIC RATING
54th/ 347
METRIC RANK
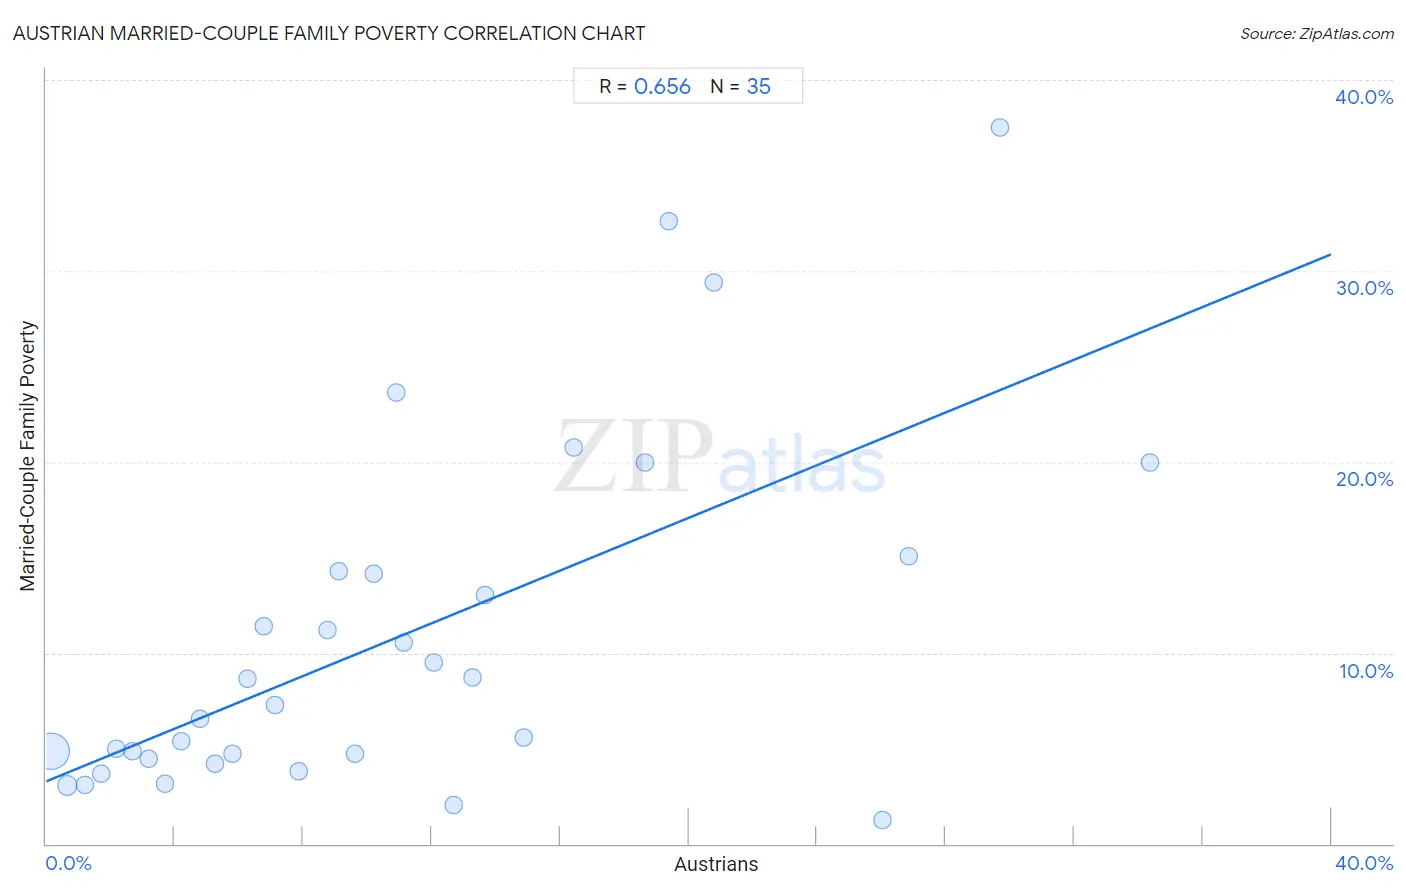
Austrian Married-Couple Family Poverty Correlation Chart
The statistical analysis conducted on geographies consisting of 445,465,391 people shows a significant positive correlation between the proportion of Austrians and poverty level among married-couple families in the United States with a correlation coefficient (R) of 0.656 and weighted average of 4.3%. On average, for every 1% (one percent) increase in Austrians within a typical geography, there is an increase of 0.69% in poverty level among married-couple families.
It is essential to understand that the correlation between the percentage of Austrians and poverty level among married-couple families does not imply a direct cause-and-effect relationship. It remains uncertain whether the presence of Austrians influences an upward or downward trend in the level of poverty level among married-couple families within an area, or if Austrians simply ended up residing in those areas with higher or lower levels of poverty level among married-couple families due to other factors.
Demographics Similar to Austrians by Married-Couple Family Poverty
In terms of married-couple family poverty, the demographic groups most similar to Austrians are French (4.3%, a difference of 0.020%), Immigrants from Zimbabwe (4.3%, a difference of 0.18%), Immigrants from Netherlands (4.3%, a difference of 0.18%), Welsh (4.3%, a difference of 0.26%), and Czechoslovakian (4.4%, a difference of 0.27%).
| Demographics | Rating | Rank | Married-Couple Family Poverty |
| Immigrants from South Central Asia | 99.8 /100 | #47 | Exceptional 4.3% |
| Australians | 99.7 /100 | #48 | Exceptional 4.3% |
| Turks | 99.7 /100 | #49 | Exceptional 4.3% |
| Burmese | 99.7 /100 | #50 | Exceptional 4.3% |
| Immigrants from Lithuania | 99.7 /100 | #51 | Exceptional 4.3% |
| Russians | 99.7 /100 | #52 | Exceptional 4.3% |
| Welsh | 99.7 /100 | #53 | Exceptional 4.3% |
| Austrians | 99.7 /100 | #54 | Exceptional 4.3% |
| French | 99.7 /100 | #55 | Exceptional 4.3% |
| Immigrants from Zimbabwe | 99.7 /100 | #56 | Exceptional 4.3% |
| Immigrants from Netherlands | 99.7 /100 | #57 | Exceptional 4.3% |
| Czechoslovakians | 99.7 /100 | #58 | Exceptional 4.4% |
| Immigrants from Sweden | 99.6 /100 | #59 | Exceptional 4.4% |
| Tlingit-Haida | 99.6 /100 | #60 | Exceptional 4.4% |
| Okinawans | 99.6 /100 | #61 | Exceptional 4.4% |
Austrian Married-Couple Family Poverty Correlation Summary
| Measurement | Austrian Data | Married-Couple Family Poverty Data |
| Minimum | 0.17% | 1.3% |
| Maximum | 34.4% | 37.5% |
| Range | 34.2% | 36.2% |
| Mean | 10.9% | 10.8% |
| Median | 9.1% | 7.2% |
| Interquartile 25% (IQ1) | 4.2% | 4.5% |
| Interquartile 75% (IQ3) | 14.9% | 14.3% |
| Interquartile Range (IQR) | 10.7% | 9.8% |
| Standard Deviation (Sample) | 8.7% | 9.1% |
| Standard Deviation (Population) | 8.5% | 9.0% |
Correlation Details
| Austrian Percentile | Sample Size | Married-Couple Family Poverty |
[ 0.0% - 0.5% ] 0.17% | 402,777,912 | 4.9% |
[ 0.5% - 1.0% ] 0.66% | 34,949,484 | 3.1% |
[ 1.0% - 1.5% ] 1.20% | 5,592,597 | 3.1% |
[ 1.5% - 2.0% ] 1.70% | 1,287,450 | 3.7% |
[ 2.0% - 2.5% ] 2.19% | 347,239 | 5.0% |
[ 2.5% - 3.0% ] 2.70% | 206,301 | 4.9% |
[ 3.0% - 3.5% ] 3.19% | 92,293 | 4.5% |
[ 3.5% - 4.0% ] 3.70% | 86,139 | 3.2% |
[ 4.0% - 4.5% ] 4.20% | 49,869 | 5.3% |
[ 4.5% - 5.0% ] 4.80% | 15,450 | 6.5% |
[ 5.0% - 5.5% ] 5.25% | 10,851 | 4.2% |
[ 5.5% - 6.0% ] 5.80% | 7,933 | 4.7% |
[ 6.0% - 6.5% ] 6.25% | 11,122 | 8.7% |
[ 6.5% - 7.0% ] 6.78% | 4,752 | 11.4% |
[ 7.0% - 7.5% ] 7.10% | 2,252 | 7.2% |
[ 7.5% - 8.0% ] 7.87% | 3,318 | 3.8% |
[ 8.5% - 9.0% ] 8.74% | 950 | 11.2% |
[ 9.0% - 9.5% ] 9.09% | 363 | 14.3% |
[ 9.5% - 10.0% ] 9.61% | 3,758 | 4.7% |
[ 10.0% - 10.5% ] 10.20% | 1,823 | 14.2% |
[ 10.5% - 11.0% ] 10.91% | 770 | 23.6% |
[ 11.0% - 11.5% ] 11.14% | 368 | 10.5% |
[ 12.0% - 12.5% ] 12.05% | 473 | 9.5% |
[ 12.5% - 13.0% ] 12.68% | 5,993 | 2.0% |
[ 13.0% - 13.5% ] 13.28% | 580 | 8.7% |
[ 13.5% - 14.0% ] 13.68% | 117 | 13.0% |
[ 14.5% - 15.0% ] 14.86% | 1,097 | 5.6% |
[ 16.0% - 16.5% ] 16.41% | 2,395 | 20.7% |
[ 18.5% - 19.0% ] 18.64% | 59 | 20.0% |
[ 19.0% - 19.5% ] 19.38% | 129 | 32.6% |
[ 20.5% - 21.0% ] 20.80% | 577 | 29.4% |
[ 26.0% - 26.5% ] 26.04% | 192 | 1.3% |
[ 26.5% - 27.0% ] 26.84% | 652 | 15.0% |
[ 29.5% - 30.0% ] 29.70% | 101 | 37.5% |
[ 34.0% - 34.5% ] 34.38% | 32 | 20.0% |