Native Hawaiian Married-Couple Family Poverty
COMPARE
Native Hawaiian
Select to Compare
Married-Couple Family Poverty
Native Hawaiian Married-Couple Family Poverty
4.6%
POVERTY | MARRIED-COUPLE FAMILIES
98.0/ 100
METRIC RATING
98th/ 347
METRIC RANK
Native Hawaiian Married-Couple Family Poverty Correlation Chart
The statistical analysis conducted on geographies consisting of 329,768,638 people shows a weak positive correlation between the proportion of Native Hawaiians and poverty level among married-couple families in the United States with a correlation coefficient (R) of 0.233 and weighted average of 4.6%. On average, for every 1% (one percent) increase in Native Hawaiians within a typical geography, there is an increase of 0.044% in poverty level among married-couple families.
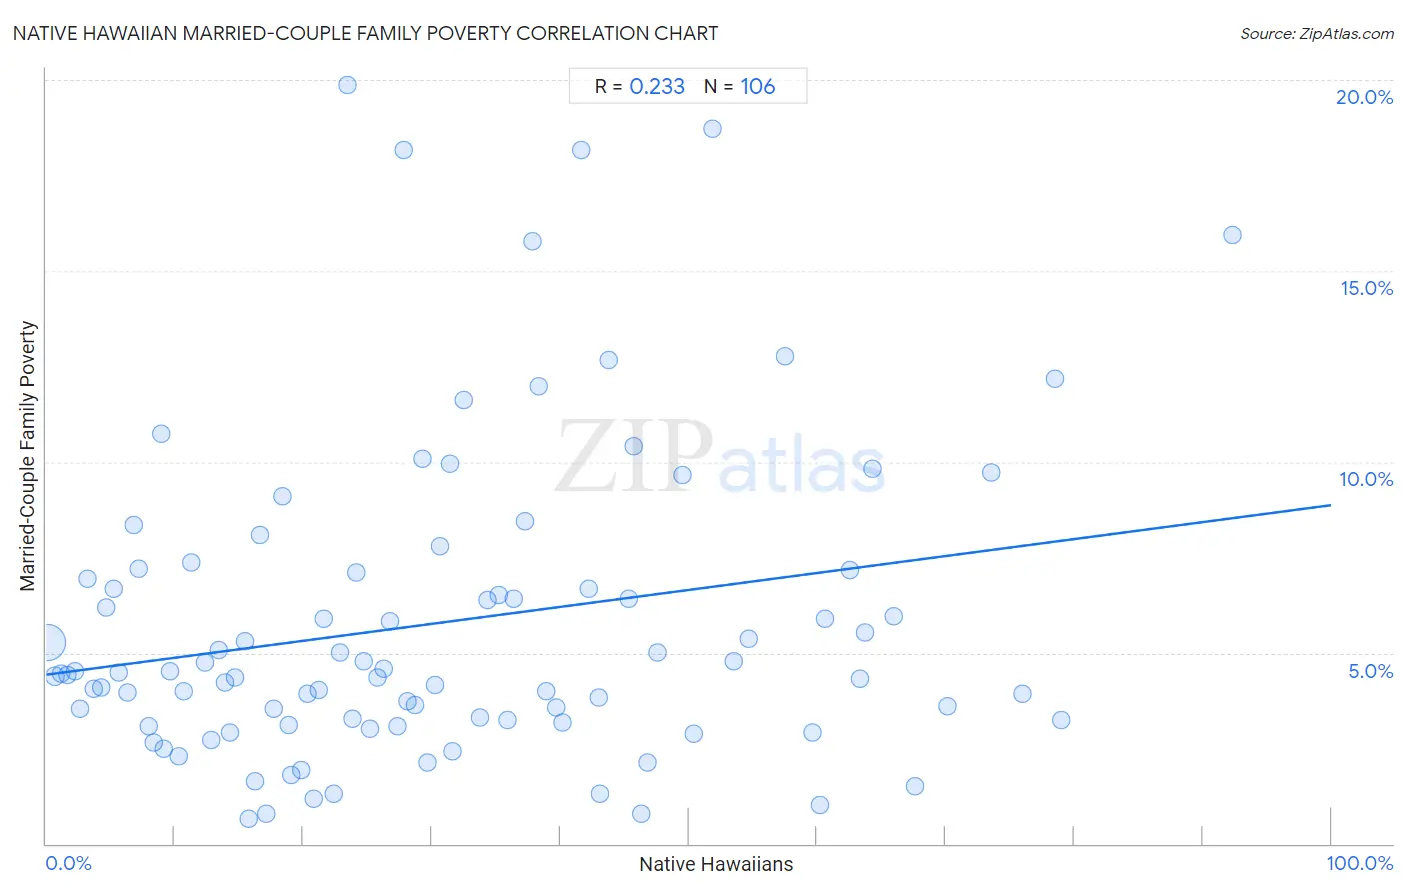
It is essential to understand that the correlation between the percentage of Native Hawaiians and poverty level among married-couple families does not imply a direct cause-and-effect relationship. It remains uncertain whether the presence of Native Hawaiians influences an upward or downward trend in the level of poverty level among married-couple families within an area, or if Native Hawaiians simply ended up residing in those areas with higher or lower levels of poverty level among married-couple families due to other factors.
Demographics Similar to Native Hawaiians by Married-Couple Family Poverty
In terms of married-couple family poverty, the demographic groups most similar to Native Hawaiians are Immigrants from Europe (4.6%, a difference of 0.12%), Immigrants from Western Europe (4.6%, a difference of 0.22%), Yugoslavian (4.6%, a difference of 0.24%), Immigrants from Belgium (4.6%, a difference of 0.43%), and Immigrants from Poland (4.6%, a difference of 0.48%).
| Demographics | Rating | Rank | Married-Couple Family Poverty |
| Basques | 98.5 /100 | #91 | Exceptional 4.6% |
| Immigrants from Norway | 98.4 /100 | #92 | Exceptional 4.6% |
| Koreans | 98.3 /100 | #93 | Exceptional 4.6% |
| Immigrants from Italy | 98.3 /100 | #94 | Exceptional 4.6% |
| Portuguese | 98.3 /100 | #95 | Exceptional 4.6% |
| Immigrants from Poland | 98.3 /100 | #96 | Exceptional 4.6% |
| Immigrants from Belgium | 98.2 /100 | #97 | Exceptional 4.6% |
| Native Hawaiians | 98.0 /100 | #98 | Exceptional 4.6% |
| Immigrants from Europe | 97.9 /100 | #99 | Exceptional 4.6% |
| Immigrants from Western Europe | 97.9 /100 | #100 | Exceptional 4.6% |
| Yugoslavians | 97.8 /100 | #101 | Exceptional 4.6% |
| Asians | 97.6 /100 | #102 | Exceptional 4.7% |
| Immigrants from Romania | 97.3 /100 | #103 | Exceptional 4.7% |
| Immigrants from Moldova | 97.1 /100 | #104 | Exceptional 4.7% |
| Aleuts | 97.0 /100 | #105 | Exceptional 4.7% |
Native Hawaiian Married-Couple Family Poverty Correlation Summary
| Measurement | Native Hawaiian Data | Married-Couple Family Poverty Data |
| Minimum | 0.12% | 0.64% |
| Maximum | 92.3% | 19.9% |
| Range | 92.1% | 19.2% |
| Mean | 30.7% | 5.8% |
| Median | 27.0% | 4.5% |
| Interquartile 25% (IQ1) | 13.9% | 3.2% |
| Interquartile 75% (IQ3) | 43.8% | 7.1% |
| Interquartile Range (IQR) | 29.9% | 3.9% |
| Standard Deviation (Sample) | 21.3% | 4.1% |
| Standard Deviation (Population) | 21.2% | 4.1% |
Correlation Details
| Native Hawaiian Percentile | Sample Size | Married-Couple Family Poverty |
[ 0.0% - 0.5% ] 0.12% | 298,815,625 | 5.3% |
[ 0.5% - 1.0% ] 0.68% | 21,788,041 | 4.4% |
[ 1.0% - 1.5% ] 1.17% | 4,226,721 | 4.5% |
[ 1.5% - 2.0% ] 1.66% | 1,365,720 | 4.4% |
[ 2.0% - 2.5% ] 2.20% | 525,662 | 4.5% |
[ 2.5% - 3.0% ] 2.65% | 144,378 | 3.5% |
[ 3.0% - 3.5% ] 3.20% | 50,309 | 6.9% |
[ 3.5% - 4.0% ] 3.67% | 23,270 | 4.1% |
[ 4.0% - 4.5% ] 4.25% | 44,783 | 4.1% |
[ 4.5% - 5.0% ] 4.66% | 35,427 | 6.2% |
[ 5.0% - 5.5% ] 5.23% | 20,711 | 6.7% |
[ 5.5% - 6.0% ] 5.61% | 11,989 | 4.5% |
[ 6.0% - 6.5% ] 6.33% | 5,719 | 4.0% |
[ 6.5% - 7.0% ] 6.84% | 29,834 | 8.3% |
[ 7.0% - 7.5% ] 7.17% | 5,367 | 7.2% |
[ 7.5% - 8.0% ] 7.94% | 7,304 | 3.1% |
[ 8.0% - 8.5% ] 8.35% | 66,131 | 2.7% |
[ 8.5% - 9.0% ] 8.92% | 6,167 | 10.7% |
[ 9.0% - 9.5% ] 9.15% | 2,141 | 2.5% |
[ 9.5% - 10.0% ] 9.61% | 31,450 | 4.5% |
[ 10.0% - 10.5% ] 10.30% | 16,692 | 2.3% |
[ 10.5% - 11.0% ] 10.73% | 18,727 | 4.0% |
[ 11.0% - 11.5% ] 11.30% | 1,018 | 7.4% |
[ 12.0% - 12.5% ] 12.39% | 464,382 | 4.7% |
[ 12.5% - 13.0% ] 12.81% | 51,581 | 2.7% |
[ 13.0% - 13.5% ] 13.39% | 102,117 | 5.1% |
[ 13.5% - 14.0% ] 13.86% | 101,514 | 4.2% |
[ 14.0% - 14.5% ] 14.35% | 103,149 | 2.9% |
[ 14.5% - 15.0% ] 14.67% | 127,370 | 4.4% |
[ 15.0% - 15.5% ] 15.42% | 6,419 | 5.3% |
[ 15.5% - 16.0% ] 15.75% | 14,411 | 0.64% |
[ 16.0% - 16.5% ] 16.25% | 162,177 | 1.6% |
[ 16.5% - 17.0% ] 16.62% | 28,086 | 8.1% |
[ 17.0% - 17.5% ] 17.14% | 51,321 | 0.80% |
[ 17.5% - 18.0% ] 17.74% | 58,669 | 3.5% |
[ 18.0% - 18.5% ] 18.39% | 223 | 9.1% |
[ 18.5% - 19.0% ] 18.85% | 117,244 | 3.1% |
[ 19.0% - 19.5% ] 19.11% | 71,880 | 1.8% |
[ 19.5% - 20.0% ] 19.85% | 34,616 | 1.9% |
[ 20.0% - 20.5% ] 20.35% | 95,020 | 3.9% |
[ 20.5% - 21.0% ] 20.86% | 28,140 | 1.2% |
[ 21.0% - 21.5% ] 21.22% | 21,055 | 4.0% |
[ 21.5% - 22.0% ] 21.64% | 15,015 | 5.9% |
[ 22.0% - 22.5% ] 22.35% | 13,335 | 1.3% |
[ 22.5% - 23.0% ] 22.88% | 43,342 | 5.0% |
[ 23.0% - 23.5% ] 23.43% | 3,073 | 19.9% |
[ 23.5% - 24.0% ] 23.83% | 52,848 | 3.3% |
[ 24.0% - 24.5% ] 24.16% | 6,892 | 7.1% |
[ 24.5% - 25.0% ] 24.68% | 36,062 | 4.8% |
[ 25.0% - 25.5% ] 25.19% | 2,211 | 3.0% |
[ 25.5% - 26.0% ] 25.76% | 11,376 | 4.3% |
[ 26.0% - 26.5% ] 26.30% | 2,255 | 4.6% |
[ 26.5% - 27.0% ] 26.78% | 26,147 | 5.8% |
[ 27.0% - 27.5% ] 27.32% | 63,950 | 3.1% |
[ 27.5% - 28.0% ] 27.83% | 618 | 18.2% |
[ 28.0% - 28.5% ] 28.13% | 49,623 | 3.7% |
[ 28.5% - 29.0% ] 28.69% | 26,967 | 3.6% |
[ 29.0% - 29.5% ] 29.32% | 4,796 | 10.1% |
[ 29.5% - 30.0% ] 29.67% | 62,893 | 2.1% |
[ 30.0% - 30.5% ] 30.29% | 2,242 | 4.2% |
[ 30.5% - 31.0% ] 30.60% | 2,716 | 7.8% |
[ 31.0% - 31.5% ] 31.44% | 4,628 | 10.0% |
[ 31.5% - 32.0% ] 31.62% | 7,704 | 2.4% |
[ 32.5% - 33.0% ] 32.52% | 3,484 | 11.6% |
[ 33.5% - 34.0% ] 33.75% | 51,896 | 3.3% |
[ 34.0% - 34.5% ] 34.32% | 5,668 | 6.4% |
[ 35.0% - 35.5% ] 35.26% | 27,351 | 6.5% |
[ 35.5% - 36.0% ] 35.92% | 27,766 | 3.2% |
[ 36.0% - 36.5% ] 36.35% | 2,421 | 6.4% |
[ 37.0% - 37.5% ] 37.28% | 5,638 | 8.5% |
[ 37.5% - 38.0% ] 37.82% | 1,666 | 15.8% |
[ 38.0% - 38.5% ] 38.29% | 1,972 | 12.0% |
[ 38.5% - 39.0% ] 38.95% | 50,453 | 4.0% |
[ 39.5% - 40.0% ] 39.66% | 49,256 | 3.6% |
[ 40.0% - 40.5% ] 40.13% | 1,834 | 3.2% |
[ 41.5% - 42.0% ] 41.66% | 1,781 | 18.2% |
[ 42.0% - 42.5% ] 42.22% | 15,863 | 6.7% |
[ 42.5% - 43.0% ] 42.99% | 4,555 | 3.8% |
[ 43.0% - 43.5% ] 43.05% | 11,029 | 1.3% |
[ 43.5% - 44.0% ] 43.77% | 4,135 | 12.7% |
[ 45.0% - 45.5% ] 45.29% | 10,042 | 6.4% |
[ 45.5% - 46.0% ] 45.76% | 17,696 | 10.4% |
[ 46.0% - 46.5% ] 46.26% | 1,096 | 0.80% |
[ 46.5% - 47.0% ] 46.76% | 3,593 | 2.1% |
[ 47.5% - 48.0% ] 47.53% | 5,026 | 5.0% |
[ 49.5% - 50.0% ] 49.55% | 890 | 9.6% |
[ 50.0% - 50.5% ] 50.39% | 3,832 | 2.9% |
[ 51.5% - 52.0% ] 51.81% | 4,366 | 18.7% |
[ 53.0% - 53.5% ] 53.49% | 3,221 | 4.8% |
[ 54.5% - 55.0% ] 54.72% | 3,149 | 5.4% |
[ 57.0% - 57.5% ] 57.46% | 731 | 12.8% |
[ 59.5% - 60.0% ] 59.67% | 12,114 | 2.9% |
[ 60.0% - 60.5% ] 60.21% | 480 | 1.0% |
[ 60.5% - 61.0% ] 60.59% | 51,367 | 5.9% |
[ 62.5% - 63.0% ] 62.57% | 2,872 | 7.2% |
[ 63.0% - 63.5% ] 63.35% | 4,827 | 4.3% |
[ 63.5% - 64.0% ] 63.68% | 14,129 | 5.5% |
[ 64.0% - 64.5% ] 64.30% | 902 | 9.8% |
[ 65.5% - 66.0% ] 65.97% | 3,553 | 6.0% |
[ 67.5% - 68.0% ] 67.63% | 10,307 | 1.5% |
[ 70.0% - 70.5% ] 70.09% | 3,133 | 3.6% |
[ 73.5% - 74.0% ] 73.53% | 12,370 | 9.7% |
[ 75.5% - 76.0% ] 75.96% | 2,853 | 3.9% |
[ 78.0% - 78.5% ] 78.49% | 2,157 | 12.2% |
[ 78.5% - 79.0% ] 78.97% | 4,475 | 3.2% |
[ 92.0% - 92.5% ] 92.27% | 1,436 | 15.9% |