Bermudan Married-Couple Family Poverty

COMPARE

Bermudan
Race
Ancestry
AfghanAfricanAlaska NativeAlaskan AthabascanAlbanianAleutAlsatianAmericanApacheArabArapahoArgentineanArmenianAssyrian/Chaldean/SyriacAustralianAustrianBahamianBangladeshiBarbadianBasqueBelgianBelizeanBermudanBhutaneseBlackfeetBolivianBrazilianBritishBritish West IndianBulgarianBurmeseCajunCambodianCanadianCape VerdeanCarpatho RusynCelticCentral AmericanCentral American IndianCherokeeCheyenneChickasawChileanChineseChippewaChoctawColombianColvilleComancheCosta RicanCreeCreekCroatianCrowCubanCypriotCzechCzechoslovakianDanishDelawareDominicanDutchDutch West IndianEastern EuropeanEcuadorianEgyptianEnglishEstonianEthiopianEuropeanFijianFilipinoFinnishFrenchFrench American IndianFrench CanadianGermanGerman RussianGhanaianGreekGuamanian/ChamorroGuatemalanGuyaneseHaitianHmongHonduranHopiHoumaHungarianIcelanderIndian (Asian)IndonesianInupiatIranianIraqiIrishIroquoisIsraeliItalianJamaicanJapaneseJordanianKenyanKiowaKoreanLaotianLatvianLebaneseLiberianLithuanianLumbeeLuxembourgerMacedonianMalaysianMalteseMarshalleseMenomineeMexicanMexican American IndianMongolianMoroccanNative HawaiianNavajoNepaleseNew ZealanderNicaraguanNigerianNorthern EuropeanNorwegianOkinawanOsageOttawaPaiutePakistaniPalestinianPanamanianParaguayanPennsylvania GermanPeruvianPimaPolishPortuguesePotawatomiPuebloPuerto RicanPuget Sound SalishRomanianRussianSalvadoranSamoanScandinavianScotch-IrishScottishSeminoleSenegaleseSerbianShoshoneSierra LeoneanSiouxSlavicSlovakSloveneSomaliSouth AfricanSouth AmericanSouth American IndianSoviet UnionSpaniardSpanishSpanish AmericanSpanish American IndianSri LankanSubsaharan AfricanSudaneseSwedishSwissSyrianTaiwaneseThaiTlingit-HaidaTohono O'OdhamTonganTrinidadian and TobagonianTsimshianTurkishU.S. Virgin IslanderUgandanUkrainianUruguayanUteVenezuelanVietnameseWelshWest IndianYakamaYaquiYugoslavianYumanYup'ikZimbabwean
Immigration
NonimmigrantsImmigrantsAfghanistanAfricaAlbaniaArgentinaArmeniaAsiaAustraliaAustriaBahamasBangladeshBarbadosBelarusBelgiumBelizeBoliviaBosnia and HerzegovinaBrazilBulgariaBurma/MyanmarCabo VerdeCambodiaCameroonCanadaCaribbeanCentral AmericaChileChinaColombiaCongoCosta RicaCroatiaCubaCzechoslovakiaDenmarkDominicaDominican RepublicEastern AfricaEastern AsiaEastern EuropeEcuadorEgyptEl SalvadorEnglandEritreaEthiopiaEuropeFijiFranceGermanyGhanaGreeceGrenadaGuatemalaGuyanaHaitiHondurasHong KongHungaryIndiaIndonesiaIranIraqIrelandIsraelItalyJamaicaJapanJordanKazakhstanKenyaKoreaKuwaitLaosLatin AmericaLatviaLebanonLiberiaLithuaniaMalaysiaMexicoMicronesiaMiddle AfricaMoldovaMoroccoNepalNetherlandsNicaraguaNigeriaNorth AmericaNorth MacedoniaNorthern AfricaNorthern EuropeNorwayOceaniaPakistanPanamaPeruPhilippinesPolandPortugalRomaniaRussiaSaudi ArabiaScotlandSenegalSerbiaSierra LeoneSingaporeSomaliaSouth AfricaSouth AmericaSouth Central AsiaSouth Eastern AsiaSouthern EuropeSpainSri LankaSt. Vincent and the GrenadinesSudanSwedenSwitzerlandSyriaTaiwanThailandTrinidad and TobagoTurkeyUgandaUkraineUruguayUzbekistanVenezuelaVietnamWest IndiesWestern AfricaWestern AsiaWestern EuropeYemenZaireZimbabweAzores
Select to Compare
Race
Ancestry
AfghanAfricanAlaska NativeAlaskan AthabascanAlbanianAleutAlsatianAmericanApacheArabArapahoArgentineanArmenianAssyrian/Chaldean/SyriacAustralianAustrianBahamianBangladeshiBarbadianBasqueBelgianBelizeanBhutaneseBlackfeetBolivianBrazilianBritishBritish West IndianBulgarianBurmeseCajunCambodianCanadianCape VerdeanCarpatho RusynCelticCentral AmericanCentral American IndianCherokeeCheyenneChickasawChileanChineseChippewaChoctawColombianColvilleComancheCosta RicanCreeCreekCroatianCrowCubanCypriotCzechCzechoslovakianDanishDelawareDominicanDutchDutch West IndianEastern EuropeanEcuadorianEgyptianEnglishEstonianEthiopianEuropeanFijianFilipinoFinnishFrenchFrench American IndianFrench CanadianGermanGerman RussianGhanaianGreekGuamanian/ChamorroGuatemalanGuyaneseHaitianHmongHonduranHopiHoumaHungarianIcelanderIndian (Asian)IndonesianInupiatIranianIraqiIrishIroquoisIsraeliItalianJamaicanJapaneseJordanianKenyanKiowaKoreanLaotianLatvianLebaneseLiberianLithuanianLumbeeLuxembourgerMacedonianMalaysianMalteseMarshalleseMenomineeMexicanMexican American IndianMongolianMoroccanNative HawaiianNavajoNepaleseNew ZealanderNicaraguanNigerianNorthern EuropeanNorwegianOkinawanOsageOttawaPaiutePakistaniPalestinianPanamanianParaguayanPennsylvania GermanPeruvianPimaPolishPortuguesePotawatomiPuebloPuerto RicanPuget Sound SalishRomanianRussianSalvadoranSamoanScandinavianScotch-IrishScottishSeminoleSenegaleseSerbianShoshoneSierra LeoneanSiouxSlavicSlovakSloveneSomaliSouth AfricanSouth AmericanSouth American IndianSoviet UnionSpaniardSpanishSpanish AmericanSpanish American IndianSri LankanSubsaharan AfricanSudaneseSwedishSwissSyrianTaiwaneseThaiTlingit-HaidaTohono O'OdhamTonganTrinidadian and TobagonianTsimshianTurkishU.S. Virgin IslanderUgandanUkrainianUruguayanUteVenezuelanVietnameseWelshWest IndianYakamaYaquiYugoslavianYumanYup'ikZimbabwean
Immigration
NonimmigrantsImmigrantsAfghanistanAfricaAlbaniaArgentinaArmeniaAsiaAustraliaAustriaBahamasBangladeshBarbadosBelarusBelgiumBelizeBoliviaBosnia and HerzegovinaBrazilBulgariaBurma/MyanmarCabo VerdeCambodiaCameroonCanadaCaribbeanCentral AmericaChileChinaColombiaCongoCosta RicaCroatiaCubaCzechoslovakiaDenmarkDominicaDominican RepublicEastern AfricaEastern AsiaEastern EuropeEcuadorEgyptEl SalvadorEnglandEritreaEthiopiaEuropeFijiFranceGermanyGhanaGreeceGrenadaGuatemalaGuyanaHaitiHondurasHong KongHungaryIndiaIndonesiaIranIraqIrelandIsraelItalyJamaicaJapanJordanKazakhstanKenyaKoreaKuwaitLaosLatin AmericaLatviaLebanonLiberiaLithuaniaMalaysiaMexicoMicronesiaMiddle AfricaMoldovaMoroccoNepalNetherlandsNicaraguaNigeriaNorth AmericaNorth MacedoniaNorthern AfricaNorthern EuropeNorwayOceaniaPakistanPanamaPeruPhilippinesPolandPortugalRomaniaRussiaSaudi ArabiaScotlandSenegalSerbiaSierra LeoneSingaporeSomaliaSouth AfricaSouth AmericaSouth Central AsiaSouth Eastern AsiaSouthern EuropeSpainSri LankaSt. Vincent and the GrenadinesSudanSwedenSwitzerlandSyriaTaiwanThailandTrinidad and TobagoTurkeyUgandaUkraineUruguayUzbekistanVenezuelaVietnamWest IndiesWestern AfricaWestern AsiaWestern EuropeYemenZaireZimbabweAzores
Married-Couple Family Poverty
Income
Poverty
Unemployment
Labor Participation
Family Structure
Vehicle Availability
Education Level
Disability

Bermudan Married-Couple Family Poverty
Average

5.2%
POVERTY | MARRIED-COUPLE FAMILIES
52.9/ 100
METRIC RATING
171st/ 347
METRIC RANK

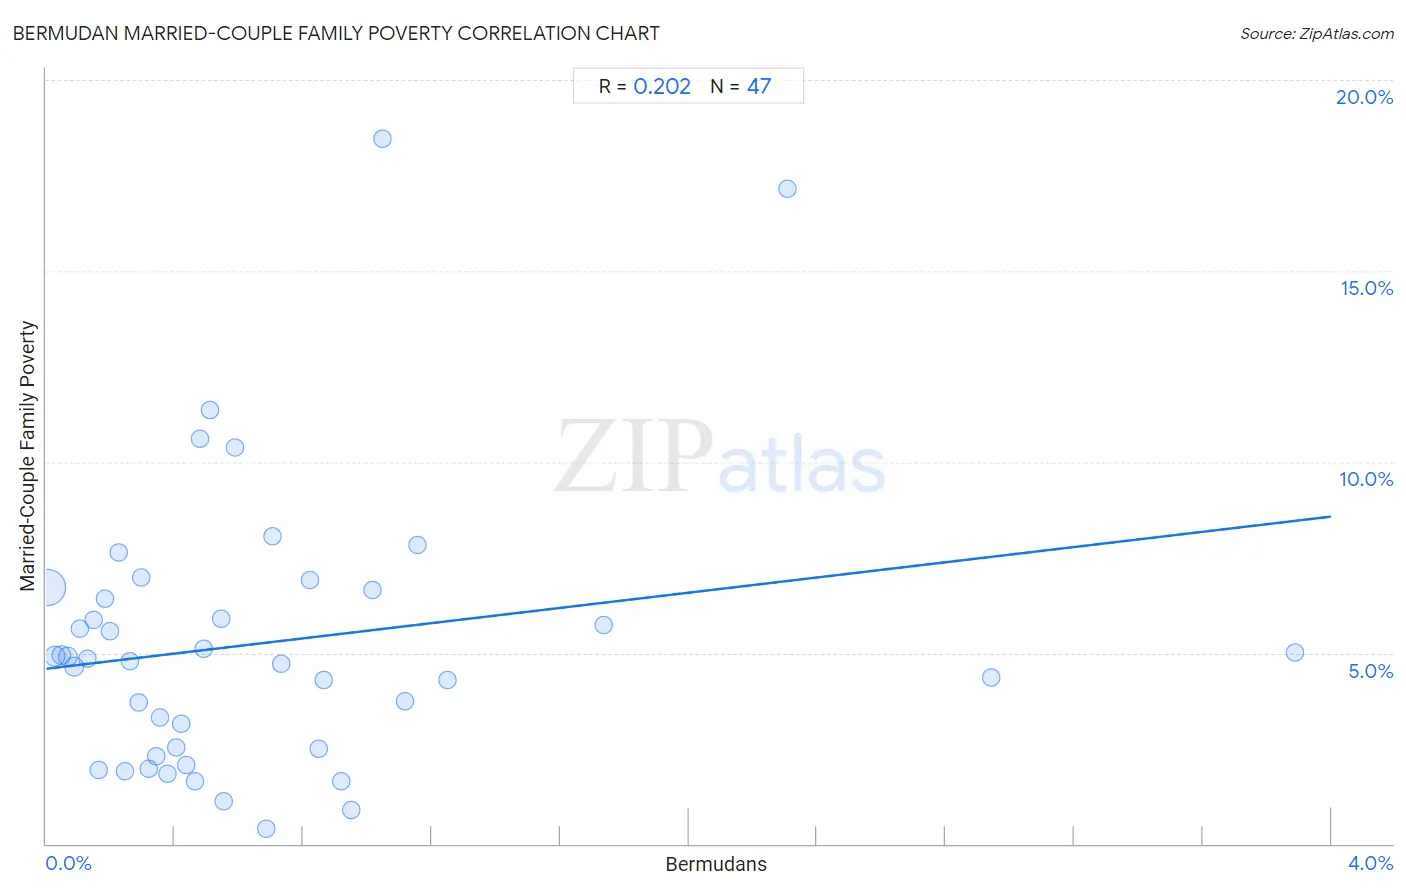
Bermudan Married-Couple Family Poverty Correlation Chart

The statistical analysis conducted on geographies consisting of 55,613,061 people shows a weak positive correlation between the proportion of Bermudans and poverty level among married-couple families in the United States with a correlation coefficient (R) of 0.202 and weighted average of 5.2%. On average, for every 1% (one percent) increase in Bermudans within a typical geography, there is an increase of 1.00% in poverty level among married-couple families.
Bermudan Married-Couple Family Poverty
It is essential to understand that the correlation between the percentage of Bermudans and poverty level among married-couple families does not imply a direct cause-and-effect relationship. It remains uncertain whether the presence of Bermudans influences an upward or downward trend in the level of poverty level among married-couple families within an area, or if Bermudans simply ended up residing in those areas with higher or lower levels of poverty level among married-couple families due to other factors.

Demographics Similar to Bermudans by Married-Couple Family Poverty

In terms of married-couple family poverty, the demographic groups most similar to Bermudans are Immigrants from Argentina (5.2%, a difference of 0.18%), Immigrants from Northern Africa (5.2%, a difference of 0.18%), Ottawa (5.2%, a difference of 0.19%), Alsatian (5.2%, a difference of 0.20%), and Immigrants from Uganda (5.2%, a difference of 0.23%).
DemographicsRating | RankMarried-Couple Family Poverty
Hawaiians
62.3
/100
|
#164
Good
5.1%
Immigrants from Malaysia
62.2
/100
|
#165
Good
5.1%
Paraguayans
61.5
/100
|
#166
Good
5.1%
Costa Ricans
61.5
/100
|
#167
Good
5.1%
Immigrants from Uganda
54.9
/100
|
#168
Average
5.2%
Ottawa
54.5
/100
|
#169
Average
5.2%
Immigrants from Argentina
54.4
/100
|
#170
Average
5.2%
Bermudans
52.9
/100
|
#171
Average
5.2%
Immigrants from Northern Africa
51.3
/100
|
#172
Average
5.2%
Alsatians
51.2
/100
|
#173
Average
5.2%
Immigrants from Eastern Africa
50.0
/100
|
#174
Average
5.2%
Marshallese
47.9
/100
|
#175
Average
5.2%
Menominee
47.8
/100
|
#176
Average
5.2%
Immigrants from Kazakhstan
45.1
/100
|
#177
Average
5.2%
Immigrants from Ukraine
44.9
/100
|
#178
Average
5.2%

Bermudan Married-Couple Family Poverty Correlation Summary

MeasurementBermudan DataMarried-Couple Family Poverty Data
Minimum0.0057%0.39%
Maximum3.9%18.5%
Range3.9%18.1%
Mean0.67%5.3%
Median0.46%4.9%
Interquartile 25% (IQ1)0.23%2.5%
Interquartile 75% (IQ3)0.86%6.6%
Interquartile Range (IQR)0.64%4.1%
Standard Deviation (Sample)0.75%3.7%
Standard Deviation (Population)0.74%3.6%

Correlation Details

Bermudan PercentileSample SizeMarried-Couple Family Poverty
[
0.0%
-
0.5%
]
0.0057%
42,073,7336.7%
[
0.0%
-
0.5%
]
0.027%
5,755,7454.9%
[
0.0%
-
0.5%
]
0.046%
2,598,0424.9%
[
0.0%
-
0.5%
]
0.067%
1,322,0604.9%
[
0.0%
-
0.5%
]
0.087%
877,7324.6%
[
0.0%
-
0.5%
]
0.11%
582,2115.6%
[
0.0%
-
0.5%
]
0.13%
175,2684.9%
[
0.0%
-
0.5%
]
0.15%
357,9105.9%
[
0.0%
-
0.5%
]
0.16%
193,4931.9%
[
0.0%
-
0.5%
]
0.18%
329,0416.4%
[
0.0%
-
0.5%
]
0.20%
200,2435.6%
[
0.0%
-
0.5%
]
0.23%
122,9937.6%
[
0.0%
-
0.5%
]
0.25%
59,2231.9%
[
0.0%
-
0.5%
]
0.26%
188,3984.8%
[
0.0%
-
0.5%
]
0.29%
82,8473.7%
[
0.0%
-
0.5%
]
0.30%
99,4597.0%
[
0.0%
-
0.5%
]
0.32%
29,9102.0%
[
0.0%
-
0.5%
]
0.34%
40,3732.3%
[
0.0%
-
0.5%
]
0.35%
73,9953.3%
[
0.0%
-
0.5%
]
0.38%
17,6711.8%
[
0.0%
-
0.5%
]
0.40%
23,3352.5%
[
0.0%
-
0.5%
]
0.42%
72,9893.1%
[
0.0%
-
0.5%
]
0.44%
3,2122.1%
[
0.0%
-
0.5%
]
0.46%
45,2691.6%
[
0.0%
-
0.5%
]
0.48%
33,52310.6%
[
0.0%
-
0.5%
]
0.49%
2,0395.1%
[
0.5%
-
1.0%
]
0.51%
5,89711.4%
[
0.5%
-
1.0%
]
0.54%
48,3615.9%
[
0.5%
-
1.0%
]
0.55%
54,8511.1%
[
0.5%
-
1.0%
]
0.59%
3,40610.4%
[
0.5%
-
1.0%
]
0.68%
2,0500.39%
[
0.5%
-
1.0%
]
0.70%
5,1158.0%
[
0.5%
-
1.0%
]
0.73%
2,7314.7%
[
0.5%
-
1.0%
]
0.82%
10,6026.9%
[
0.5%
-
1.0%
]
0.85%
51,9382.5%
[
0.5%
-
1.0%
]
0.86%
3,0064.3%
[
0.5%
-
1.0%
]
0.92%
5,3381.6%
[
0.5%
-
1.0%
]
0.95%
4,2210.87%
[
1.0%
-
1.5%
]
1.01%
24,5516.6%
[
1.0%
-
1.5%
]
1.05%
1,81818.5%
[
1.0%
-
1.5%
]
1.12%
8963.7%
[
1.0%
-
1.5%
]
1.16%
9,7677.8%
[
1.0%
-
1.5%
]
1.25%
8,0024.3%
[
1.5%
-
2.0%
]
1.73%
1735.7%
[
2.0%
-
2.5%
]
2.31%
3,77017.1%
[
2.5%
-
3.0%
]
2.94%
3744.3%
[
3.5%
-
4.0%
]
3.89%
5,4805.0%