Immigrants from Norway Married-Couple Family Poverty
COMPARE
Immigrants from Norway
Select to Compare
Married-Couple Family Poverty
Immigrants from Norway Married-Couple Family Poverty
4.6%
POVERTY | MARRIED-COUPLE FAMILIES
98.4/ 100
METRIC RATING
92nd/ 347
METRIC RANK
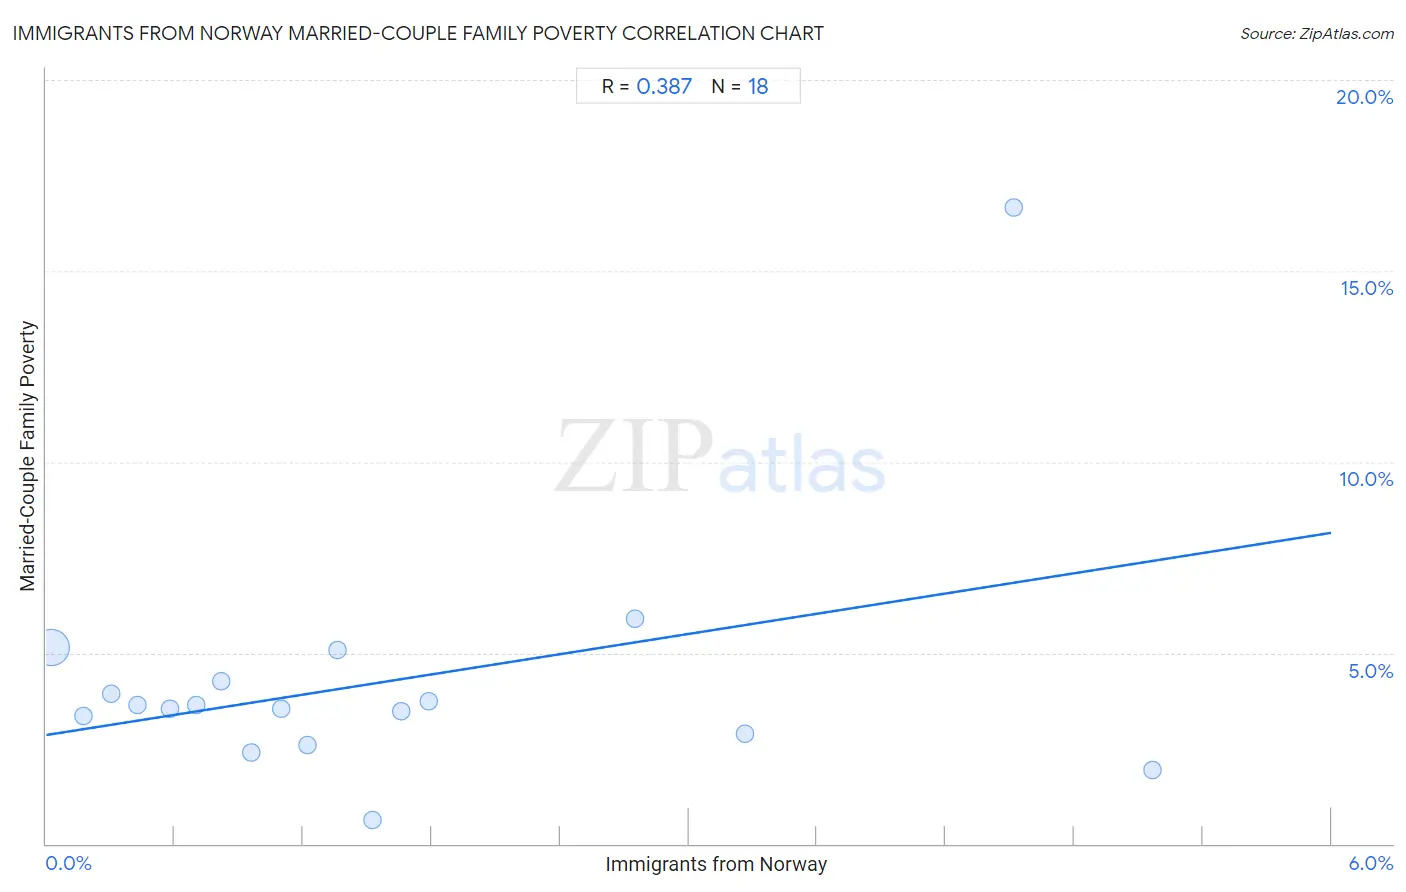
Immigrants from Norway Married-Couple Family Poverty Correlation Chart
The statistical analysis conducted on geographies consisting of 116,278,414 people shows a mild positive correlation between the proportion of Immigrants from Norway and poverty level among married-couple families in the United States with a correlation coefficient (R) of 0.387 and weighted average of 4.6%. On average, for every 1% (one percent) increase in Immigrants from Norway within a typical geography, there is an increase of 0.88% in poverty level among married-couple families.
It is essential to understand that the correlation between the percentage of Immigrants from Norway and poverty level among married-couple families does not imply a direct cause-and-effect relationship. It remains uncertain whether the presence of Immigrants from Norway influences an upward or downward trend in the level of poverty level among married-couple families within an area, or if Immigrants from Norway simply ended up residing in those areas with higher or lower levels of poverty level among married-couple families due to other factors.
Demographics Similar to Immigrants from Norway by Married-Couple Family Poverty
In terms of married-couple family poverty, the demographic groups most similar to Immigrants from Norway are Basque (4.6%, a difference of 0.080%), Immigrants from Switzerland (4.6%, a difference of 0.11%), Immigrants from Czechoslovakia (4.6%, a difference of 0.18%), Korean (4.6%, a difference of 0.18%), and Immigrants from Italy (4.6%, a difference of 0.23%).
| Demographics | Rating | Rank | Married-Couple Family Poverty |
| South Africans | 98.7 /100 | #85 | Exceptional 4.6% |
| Immigrants from Turkey | 98.6 /100 | #86 | Exceptional 4.6% |
| Immigrants from North Macedonia | 98.6 /100 | #87 | Exceptional 4.6% |
| Bolivians | 98.6 /100 | #88 | Exceptional 4.6% |
| Immigrants from Czechoslovakia | 98.5 /100 | #89 | Exceptional 4.6% |
| Immigrants from Switzerland | 98.5 /100 | #90 | Exceptional 4.6% |
| Basques | 98.5 /100 | #91 | Exceptional 4.6% |
| Immigrants from Norway | 98.4 /100 | #92 | Exceptional 4.6% |
| Koreans | 98.3 /100 | #93 | Exceptional 4.6% |
| Immigrants from Italy | 98.3 /100 | #94 | Exceptional 4.6% |
| Portuguese | 98.3 /100 | #95 | Exceptional 4.6% |
| Immigrants from Poland | 98.3 /100 | #96 | Exceptional 4.6% |
| Immigrants from Belgium | 98.2 /100 | #97 | Exceptional 4.6% |
| Native Hawaiians | 98.0 /100 | #98 | Exceptional 4.6% |
| Immigrants from Europe | 97.9 /100 | #99 | Exceptional 4.6% |
Immigrants from Norway Married-Couple Family Poverty Correlation Summary
| Measurement | Immigrants from Norway Data | Married-Couple Family Poverty Data |
| Minimum | 0.022% | 0.62% |
| Maximum | 5.2% | 16.7% |
| Range | 5.1% | 16.1% |
| Mean | 1.6% | 4.2% |
| Median | 1.2% | 3.6% |
| Interquartile 25% (IQ1) | 0.58% | 2.9% |
| Interquartile 75% (IQ3) | 1.8% | 4.2% |
| Interquartile Range (IQR) | 1.2% | 1.4% |
| Standard Deviation (Sample) | 1.5% | 3.3% |
| Standard Deviation (Population) | 1.4% | 3.2% |
Correlation Details
| Immigrants from Norway Percentile | Sample Size | Married-Couple Family Poverty |
[ 0.0% - 0.5% ] 0.022% | 111,544,987 | 5.2% |
[ 0.0% - 0.5% ] 0.18% | 3,303,022 | 3.4% |
[ 0.0% - 0.5% ] 0.30% | 751,386 | 3.9% |
[ 0.0% - 0.5% ] 0.42% | 296,266 | 3.6% |
[ 0.5% - 1.0% ] 0.58% | 174,052 | 3.5% |
[ 0.5% - 1.0% ] 0.70% | 85,857 | 3.6% |
[ 0.5% - 1.0% ] 0.82% | 62,697 | 4.2% |
[ 0.5% - 1.0% ] 0.95% | 3,877 | 2.4% |
[ 1.0% - 1.5% ] 1.10% | 7,206 | 3.5% |
[ 1.0% - 1.5% ] 1.22% | 7,798 | 2.6% |
[ 1.0% - 1.5% ] 1.36% | 3,082 | 5.1% |
[ 1.5% - 2.0% ] 1.53% | 16,249 | 0.62% |
[ 1.5% - 2.0% ] 1.66% | 7,891 | 3.5% |
[ 1.5% - 2.0% ] 1.79% | 7,001 | 3.7% |
[ 2.5% - 3.0% ] 2.75% | 473 | 5.9% |
[ 3.0% - 3.5% ] 3.27% | 1,807 | 2.9% |
[ 4.5% - 5.0% ] 4.52% | 177 | 16.7% |
[ 5.0% - 5.5% ] 5.17% | 4,586 | 1.9% |