Immigrants from Nepal Married-Couple Family Poverty
COMPARE
Immigrants from Nepal
Select to Compare
Married-Couple Family Poverty
Immigrants from Nepal Married-Couple Family Poverty
4.7%
POVERTY | MARRIED-COUPLE FAMILIES
95.9/ 100
METRIC RATING
113th/ 347
METRIC RANK
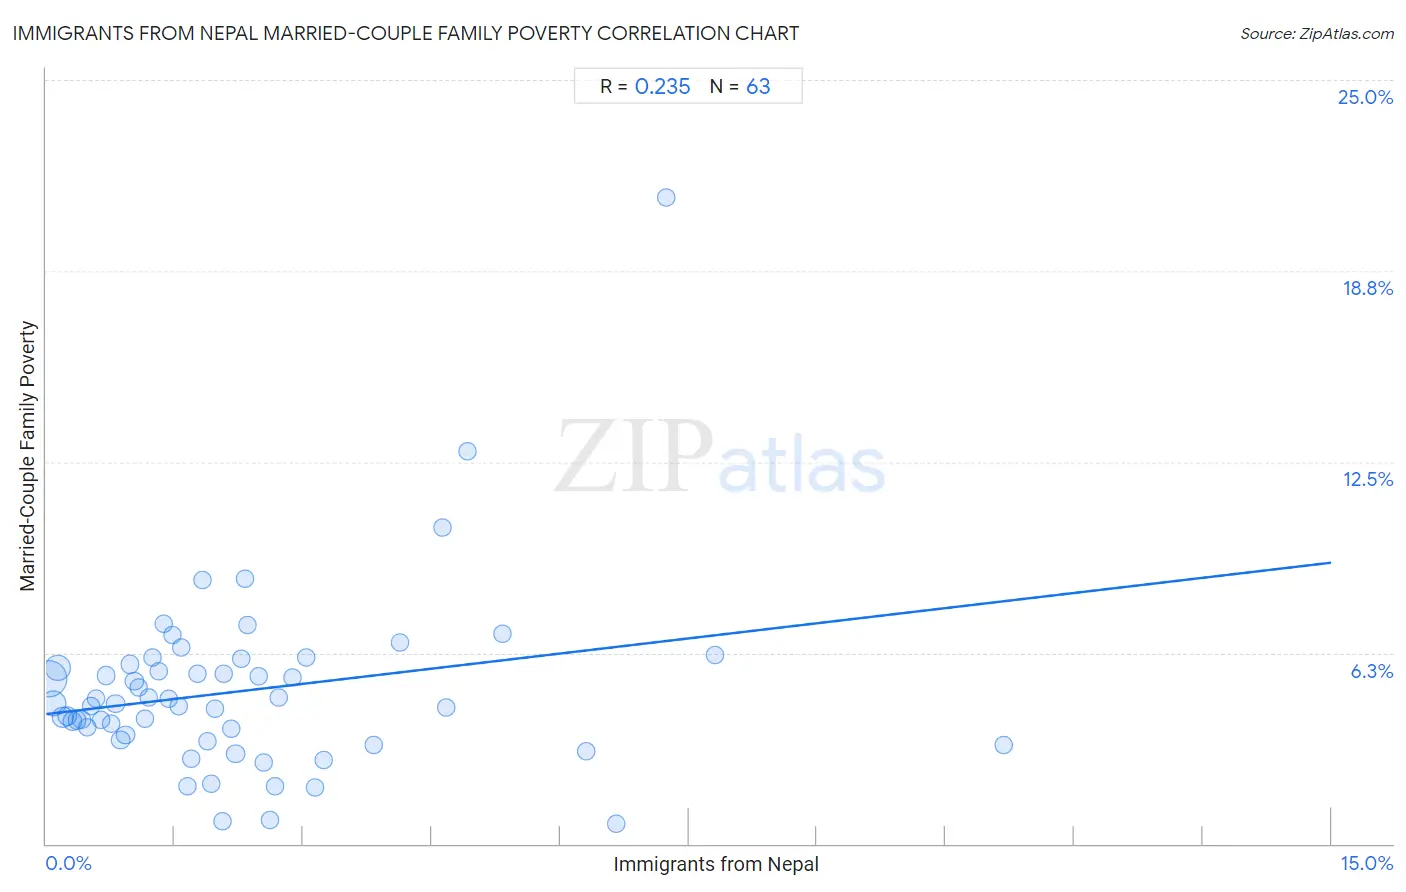
Immigrants from Nepal Married-Couple Family Poverty Correlation Chart
The statistical analysis conducted on geographies consisting of 185,979,517 people shows a weak positive correlation between the proportion of Immigrants from Nepal and poverty level among married-couple families in the United States with a correlation coefficient (R) of 0.235 and weighted average of 4.7%. On average, for every 1% (one percent) increase in Immigrants from Nepal within a typical geography, there is an increase of 0.33% in poverty level among married-couple families.
It is essential to understand that the correlation between the percentage of Immigrants from Nepal and poverty level among married-couple families does not imply a direct cause-and-effect relationship. It remains uncertain whether the presence of Immigrants from Nepal influences an upward or downward trend in the level of poverty level among married-couple families within an area, or if Immigrants from Nepal simply ended up residing in those areas with higher or lower levels of poverty level among married-couple families due to other factors.
Demographics Similar to Immigrants from Nepal by Married-Couple Family Poverty
In terms of married-couple family poverty, the demographic groups most similar to Immigrants from Nepal are Tongan (4.7%, a difference of 0.070%), Pakistani (4.7%, a difference of 0.25%), Immigrants from Bolivia (4.7%, a difference of 0.29%), Immigrants from Hong Kong (4.7%, a difference of 0.45%), and Immigrants from Indonesia (4.8%, a difference of 0.58%).
| Demographics | Rating | Rank | Married-Couple Family Poverty |
| Immigrants from France | 96.9 /100 | #106 | Exceptional 4.7% |
| Immigrants from Germany | 96.8 /100 | #107 | Exceptional 4.7% |
| Laotians | 96.6 /100 | #108 | Exceptional 4.7% |
| Immigrants from Hong Kong | 96.4 /100 | #109 | Exceptional 4.7% |
| Immigrants from Bolivia | 96.2 /100 | #110 | Exceptional 4.7% |
| Pakistanis | 96.2 /100 | #111 | Exceptional 4.7% |
| Tongans | 95.9 /100 | #112 | Exceptional 4.7% |
| Immigrants from Nepal | 95.9 /100 | #113 | Exceptional 4.7% |
| Immigrants from Indonesia | 95.1 /100 | #114 | Exceptional 4.8% |
| Taiwanese | 94.8 /100 | #115 | Exceptional 4.8% |
| Celtics | 94.8 /100 | #116 | Exceptional 4.8% |
| Kenyans | 94.7 /100 | #117 | Exceptional 4.8% |
| Immigrants from Philippines | 94.6 /100 | #118 | Exceptional 4.8% |
| Immigrants from Eastern Asia | 94.0 /100 | #119 | Exceptional 4.8% |
| Immigrants from Southern Europe | 93.4 /100 | #120 | Exceptional 4.8% |
Immigrants from Nepal Married-Couple Family Poverty Correlation Summary
| Measurement | Immigrants from Nepal Data | Married-Couple Family Poverty Data |
| Minimum | 0.026% | 0.67% |
| Maximum | 11.2% | 21.1% |
| Range | 11.2% | 20.5% |
| Mean | 2.3% | 5.0% |
| Median | 1.8% | 4.6% |
| Interquartile 25% (IQ1) | 0.87% | 3.4% |
| Interquartile 75% (IQ3) | 2.7% | 5.9% |
| Interquartile Range (IQR) | 1.9% | 2.5% |
| Standard Deviation (Sample) | 2.1% | 3.0% |
| Standard Deviation (Population) | 2.1% | 3.0% |
Correlation Details
| Immigrants from Nepal Percentile | Sample Size | Married-Couple Family Poverty |
[ 0.0% - 0.5% ] 0.026% | 77,615,587 | 5.4% |
[ 0.0% - 0.5% ] 0.080% | 34,214,724 | 4.6% |
[ 0.0% - 0.5% ] 0.14% | 28,079,614 | 5.8% |
[ 0.0% - 0.5% ] 0.19% | 12,159,980 | 4.1% |
[ 0.0% - 0.5% ] 0.25% | 6,864,711 | 4.2% |
[ 0.0% - 0.5% ] 0.30% | 6,073,033 | 4.0% |
[ 0.0% - 0.5% ] 0.36% | 3,835,148 | 4.0% |
[ 0.0% - 0.5% ] 0.41% | 3,304,009 | 4.1% |
[ 0.0% - 0.5% ] 0.48% | 1,867,243 | 3.8% |
[ 0.5% - 1.0% ] 0.52% | 1,594,299 | 4.5% |
[ 0.5% - 1.0% ] 0.58% | 1,467,457 | 4.7% |
[ 0.5% - 1.0% ] 0.64% | 1,101,295 | 4.0% |
[ 0.5% - 1.0% ] 0.70% | 1,013,933 | 5.5% |
[ 0.5% - 1.0% ] 0.75% | 968,522 | 3.9% |
[ 0.5% - 1.0% ] 0.81% | 803,203 | 4.6% |
[ 0.5% - 1.0% ] 0.87% | 240,485 | 3.4% |
[ 0.5% - 1.0% ] 0.93% | 373,257 | 3.6% |
[ 0.5% - 1.0% ] 0.98% | 441,243 | 5.9% |
[ 1.0% - 1.5% ] 1.03% | 402,576 | 5.3% |
[ 1.0% - 1.5% ] 1.08% | 598,703 | 5.1% |
[ 1.0% - 1.5% ] 1.15% | 332,401 | 4.1% |
[ 1.0% - 1.5% ] 1.20% | 201,419 | 4.8% |
[ 1.0% - 1.5% ] 1.24% | 168,720 | 6.1% |
[ 1.0% - 1.5% ] 1.32% | 190,462 | 5.7% |
[ 1.0% - 1.5% ] 1.37% | 137,139 | 7.2% |
[ 1.0% - 1.5% ] 1.42% | 67,388 | 4.8% |
[ 1.0% - 1.5% ] 1.48% | 25,654 | 6.8% |
[ 1.5% - 2.0% ] 1.54% | 71,612 | 4.5% |
[ 1.5% - 2.0% ] 1.58% | 44,924 | 6.4% |
[ 1.5% - 2.0% ] 1.65% | 178,897 | 1.9% |
[ 1.5% - 2.0% ] 1.70% | 94,796 | 2.8% |
[ 1.5% - 2.0% ] 1.76% | 107,656 | 5.6% |
[ 1.5% - 2.0% ] 1.83% | 20,634 | 8.7% |
[ 1.5% - 2.0% ] 1.88% | 99,942 | 3.4% |
[ 1.5% - 2.0% ] 1.93% | 24,456 | 2.0% |
[ 1.5% - 2.0% ] 1.96% | 358,784 | 4.4% |
[ 2.0% - 2.5% ] 2.05% | 2,437 | 0.72% |
[ 2.0% - 2.5% ] 2.07% | 241 | 5.6% |
[ 2.0% - 2.5% ] 2.16% | 54,548 | 3.8% |
[ 2.0% - 2.5% ] 2.21% | 109,029 | 2.9% |
[ 2.0% - 2.5% ] 2.28% | 26,531 | 6.1% |
[ 2.0% - 2.5% ] 2.32% | 22,891 | 8.7% |
[ 2.0% - 2.5% ] 2.35% | 43,568 | 7.1% |
[ 2.0% - 2.5% ] 2.48% | 12,802 | 5.5% |
[ 2.5% - 3.0% ] 2.54% | 54,526 | 2.7% |
[ 2.5% - 3.0% ] 2.61% | 8,194 | 0.76% |
[ 2.5% - 3.0% ] 2.66% | 51,967 | 1.9% |
[ 2.5% - 3.0% ] 2.72% | 108,870 | 4.8% |
[ 2.5% - 3.0% ] 2.87% | 17,107 | 5.4% |
[ 3.0% - 3.5% ] 3.04% | 115,734 | 6.1% |
[ 3.0% - 3.5% ] 3.13% | 38,632 | 1.8% |
[ 3.0% - 3.5% ] 3.24% | 11,364 | 2.7% |
[ 3.5% - 4.0% ] 3.82% | 30,708 | 3.2% |
[ 4.0% - 4.5% ] 4.13% | 16,761 | 6.6% |
[ 4.5% - 5.0% ] 4.62% | 6,861 | 10.3% |
[ 4.5% - 5.0% ] 4.67% | 31,963 | 4.5% |
[ 4.5% - 5.0% ] 4.92% | 2,945 | 12.9% |
[ 5.0% - 5.5% ] 5.32% | 1,936 | 6.9% |
[ 6.0% - 6.5% ] 6.30% | 3,190 | 3.0% |
[ 6.5% - 7.0% ] 6.65% | 4,899 | 0.67% |
[ 7.0% - 7.5% ] 7.24% | 24,892 | 21.1% |
[ 7.5% - 8.0% ] 7.81% | 32,559 | 6.2% |
[ 11.0% - 11.5% ] 11.18% | 456 | 3.2% |