Immigrants from Bangladesh Married-Couple Family Poverty
COMPARE
Immigrants from Bangladesh
Select to Compare
Married-Couple Family Poverty
Immigrants from Bangladesh Married-Couple Family Poverty
7.5%
POVERTY | MARRIED-COUPLE FAMILIES
0.0/ 100
METRIC RATING
326th/ 347
METRIC RANK
Immigrants from Bangladesh Married-Couple Family Poverty Correlation Chart
The statistical analysis conducted on geographies consisting of 202,866,788 people shows a significant positive correlation between the proportion of Immigrants from Bangladesh and poverty level among married-couple families in the United States with a correlation coefficient (R) of 0.665 and weighted average of 7.5%. On average, for every 1% (one percent) increase in Immigrants from Bangladesh within a typical geography, there is an increase of 0.86% in poverty level among married-couple families.
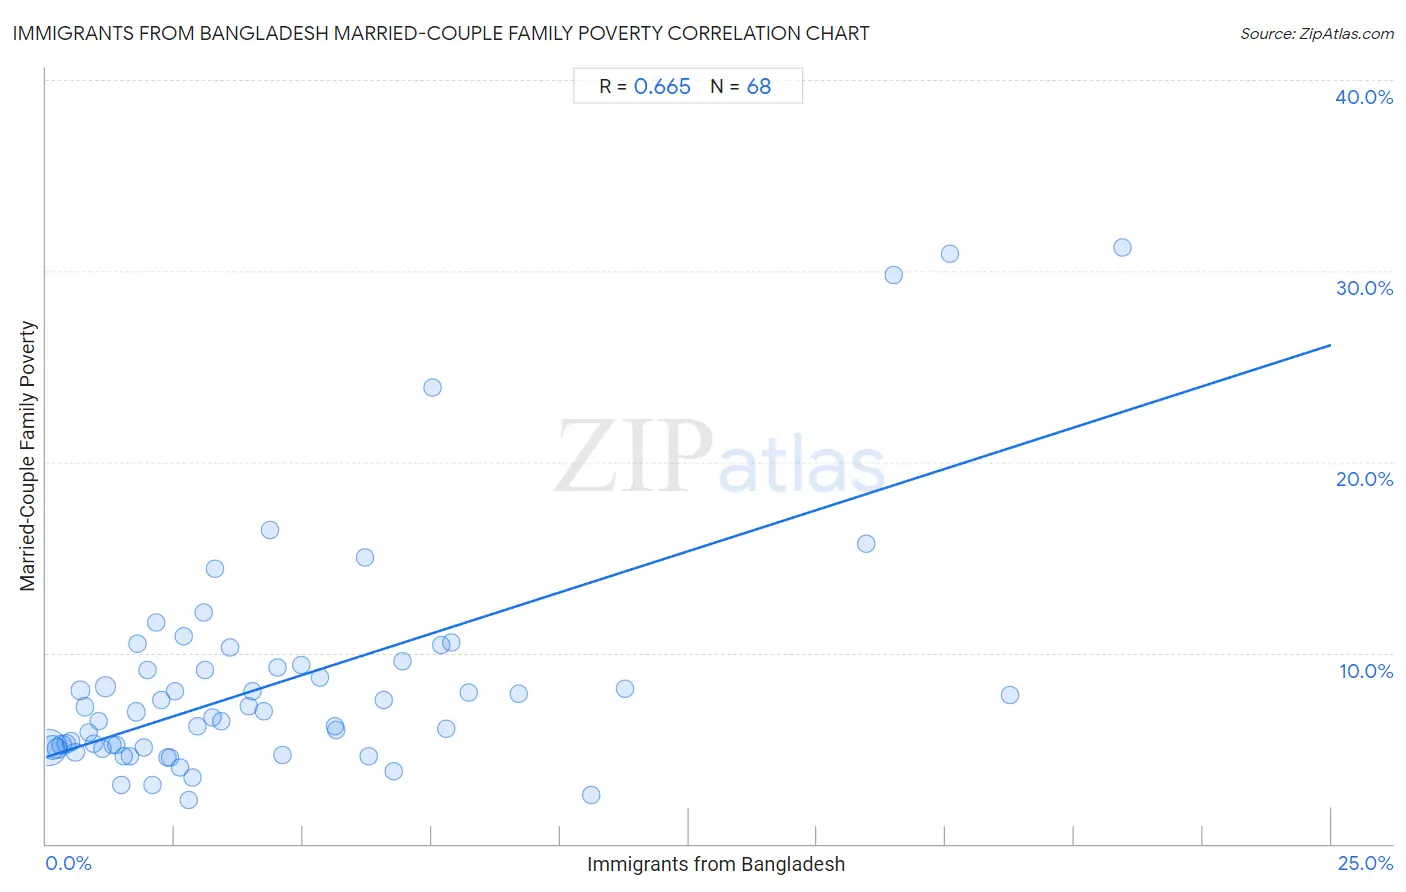
It is essential to understand that the correlation between the percentage of Immigrants from Bangladesh and poverty level among married-couple families does not imply a direct cause-and-effect relationship. It remains uncertain whether the presence of Immigrants from Bangladesh influences an upward or downward trend in the level of poverty level among married-couple families within an area, or if Immigrants from Bangladesh simply ended up residing in those areas with higher or lower levels of poverty level among married-couple families due to other factors.
Demographics Similar to Immigrants from Bangladesh by Married-Couple Family Poverty
In terms of married-couple family poverty, the demographic groups most similar to Immigrants from Bangladesh are Hispanic or Latino (7.5%, a difference of 0.0%), Immigrants from Cuba (7.5%, a difference of 0.20%), Immigrants from Central America (7.4%, a difference of 0.73%), Vietnamese (7.4%, a difference of 0.82%), and Immigrants from Mexico (7.6%, a difference of 1.2%).
| Demographics | Rating | Rank | Married-Couple Family Poverty |
| Immigrants from Latin America | 0.0 /100 | #319 | Tragic 7.2% |
| Immigrants from Grenada | 0.0 /100 | #320 | Tragic 7.3% |
| Immigrants from Caribbean | 0.0 /100 | #321 | Tragic 7.3% |
| Immigrants from Honduras | 0.0 /100 | #322 | Tragic 7.3% |
| Vietnamese | 0.0 /100 | #323 | Tragic 7.4% |
| Immigrants from Central America | 0.0 /100 | #324 | Tragic 7.4% |
| Immigrants from Cuba | 0.0 /100 | #325 | Tragic 7.5% |
| Immigrants from Bangladesh | 0.0 /100 | #326 | Tragic 7.5% |
| Hispanics or Latinos | 0.0 /100 | #327 | Tragic 7.5% |
| Immigrants from Mexico | 0.0 /100 | #328 | Tragic 7.6% |
| Natives/Alaskans | 0.0 /100 | #329 | Tragic 8.2% |
| Paiute | 0.0 /100 | #330 | Tragic 8.3% |
| Central American Indians | 0.0 /100 | #331 | Tragic 8.3% |
| Dominicans | 0.0 /100 | #332 | Tragic 8.3% |
| Lumbee | 0.0 /100 | #333 | Tragic 8.3% |
Immigrants from Bangladesh Married-Couple Family Poverty Correlation Summary
| Measurement | Immigrants from Bangladesh Data | Married-Couple Family Poverty Data |
| Minimum | 0.039% | 2.3% |
| Maximum | 20.9% | 31.2% |
| Range | 20.9% | 29.0% |
| Mean | 4.6% | 8.5% |
| Median | 3.0% | 6.9% |
| Interquartile 25% (IQ1) | 1.5% | 5.0% |
| Interquartile 75% (IQ3) | 6.2% | 9.3% |
| Interquartile Range (IQR) | 4.8% | 4.3% |
| Standard Deviation (Sample) | 4.6% | 6.0% |
| Standard Deviation (Population) | 4.6% | 6.0% |
Correlation Details
| Immigrants from Bangladesh Percentile | Sample Size | Married-Couple Family Poverty |
[ 0.0% - 0.5% ] 0.039% | 108,257,315 | 5.0% |
[ 0.0% - 0.5% ] 0.13% | 36,514,752 | 5.1% |
[ 0.0% - 0.5% ] 0.21% | 16,978,523 | 5.0% |
[ 0.0% - 0.5% ] 0.30% | 9,199,601 | 5.2% |
[ 0.0% - 0.5% ] 0.39% | 6,243,691 | 5.2% |
[ 0.0% - 0.5% ] 0.48% | 3,668,241 | 5.3% |
[ 0.5% - 1.0% ] 0.57% | 2,374,495 | 4.8% |
[ 0.5% - 1.0% ] 0.66% | 2,781,859 | 8.0% |
[ 0.5% - 1.0% ] 0.74% | 1,352,566 | 7.2% |
[ 0.5% - 1.0% ] 0.83% | 863,176 | 5.8% |
[ 0.5% - 1.0% ] 0.92% | 759,524 | 5.3% |
[ 1.0% - 1.5% ] 1.02% | 652,008 | 6.4% |
[ 1.0% - 1.5% ] 1.09% | 305,630 | 4.9% |
[ 1.0% - 1.5% ] 1.15% | 8,948,220 | 8.2% |
[ 1.0% - 1.5% ] 1.28% | 277,069 | 5.1% |
[ 1.0% - 1.5% ] 1.37% | 152,533 | 5.1% |
[ 1.0% - 1.5% ] 1.46% | 221,072 | 3.1% |
[ 1.5% - 2.0% ] 1.51% | 104,343 | 4.6% |
[ 1.5% - 2.0% ] 1.63% | 96,666 | 4.6% |
[ 1.5% - 2.0% ] 1.74% | 211,865 | 6.9% |
[ 1.5% - 2.0% ] 1.78% | 375,720 | 10.5% |
[ 1.5% - 2.0% ] 1.89% | 69,610 | 5.0% |
[ 1.5% - 2.0% ] 1.97% | 214,782 | 9.1% |
[ 2.0% - 2.5% ] 2.06% | 77,061 | 3.1% |
[ 2.0% - 2.5% ] 2.13% | 42,368 | 11.6% |
[ 2.0% - 2.5% ] 2.24% | 45,956 | 7.5% |
[ 2.0% - 2.5% ] 2.36% | 59,432 | 4.5% |
[ 2.0% - 2.5% ] 2.41% | 27,698 | 4.5% |
[ 2.5% - 3.0% ] 2.51% | 152,503 | 8.0% |
[ 2.5% - 3.0% ] 2.61% | 21,564 | 4.0% |
[ 2.5% - 3.0% ] 2.68% | 164,756 | 10.9% |
[ 2.5% - 3.0% ] 2.77% | 3,904 | 2.3% |
[ 2.5% - 3.0% ] 2.84% | 5,285 | 3.4% |
[ 2.5% - 3.0% ] 2.94% | 23,797 | 6.2% |
[ 3.0% - 3.5% ] 3.06% | 9,973 | 12.1% |
[ 3.0% - 3.5% ] 3.10% | 46,794 | 9.1% |
[ 3.0% - 3.5% ] 3.24% | 145,098 | 6.6% |
[ 3.0% - 3.5% ] 3.27% | 92,915 | 14.4% |
[ 3.0% - 3.5% ] 3.40% | 90,548 | 6.4% |
[ 3.5% - 4.0% ] 3.57% | 47,521 | 10.3% |
[ 3.5% - 4.0% ] 3.93% | 23,471 | 7.2% |
[ 4.0% - 4.5% ] 4.00% | 67,001 | 8.0% |
[ 4.0% - 4.5% ] 4.23% | 40,198 | 6.9% |
[ 4.0% - 4.5% ] 4.36% | 65,283 | 16.5% |
[ 4.5% - 5.0% ] 4.51% | 29,308 | 9.3% |
[ 4.5% - 5.0% ] 4.60% | 12,129 | 4.6% |
[ 4.5% - 5.0% ] 4.96% | 126,907 | 9.4% |
[ 5.0% - 5.5% ] 5.32% | 73,318 | 8.7% |
[ 5.5% - 6.0% ] 5.61% | 97,668 | 6.2% |
[ 5.5% - 6.0% ] 5.64% | 127,805 | 5.9% |
[ 6.0% - 6.5% ] 6.21% | 5,923 | 15.0% |
[ 6.0% - 6.5% ] 6.28% | 26,939 | 4.6% |
[ 6.5% - 7.0% ] 6.56% | 366 | 7.5% |
[ 6.5% - 7.0% ] 6.76% | 340 | 3.8% |
[ 6.5% - 7.0% ] 6.93% | 30,063 | 9.6% |
[ 7.5% - 8.0% ] 7.51% | 24,143 | 23.9% |
[ 7.5% - 8.0% ] 7.70% | 52,160 | 10.4% |
[ 7.5% - 8.0% ] 7.77% | 29,921 | 6.0% |
[ 7.5% - 8.0% ] 7.88% | 77,230 | 10.6% |
[ 8.0% - 8.5% ] 8.22% | 59,961 | 7.9% |
[ 9.0% - 9.5% ] 9.20% | 31,200 | 7.8% |
[ 10.5% - 11.0% ] 10.61% | 3,006 | 2.6% |
[ 11.0% - 11.5% ] 11.26% | 27,794 | 8.1% |
[ 15.5% - 16.0% ] 15.95% | 17,472 | 15.7% |
[ 16.0% - 16.5% ] 16.49% | 1,425 | 29.8% |
[ 17.5% - 18.0% ] 17.59% | 27,842 | 30.9% |
[ 18.5% - 19.0% ] 18.74% | 64,268 | 7.8% |
[ 20.5% - 21.0% ] 20.93% | 43,213 | 31.2% |