Shoshone Married-Couple Family Poverty

COMPARE

Shoshone
Race
Ancestry
AfghanAfricanAlaska NativeAlaskan AthabascanAlbanianAleutAlsatianAmericanApacheArabArapahoArgentineanArmenianAssyrian/Chaldean/SyriacAustralianAustrianBahamianBangladeshiBarbadianBasqueBelgianBelizeanBermudanBhutaneseBlackfeetBolivianBrazilianBritishBritish West IndianBulgarianBurmeseCajunCambodianCanadianCape VerdeanCarpatho RusynCelticCentral AmericanCentral American IndianCherokeeCheyenneChickasawChileanChineseChippewaChoctawColombianColvilleComancheCosta RicanCreeCreekCroatianCrowCubanCypriotCzechCzechoslovakianDanishDelawareDominicanDutchDutch West IndianEastern EuropeanEcuadorianEgyptianEnglishEstonianEthiopianEuropeanFijianFilipinoFinnishFrenchFrench American IndianFrench CanadianGermanGerman RussianGhanaianGreekGuamanian/ChamorroGuatemalanGuyaneseHaitianHmongHonduranHopiHoumaHungarianIcelanderIndian (Asian)IndonesianInupiatIranianIraqiIrishIroquoisIsraeliItalianJamaicanJapaneseJordanianKenyanKiowaKoreanLaotianLatvianLebaneseLiberianLithuanianLumbeeLuxembourgerMacedonianMalaysianMalteseMarshalleseMenomineeMexicanMexican American IndianMongolianMoroccanNative HawaiianNavajoNepaleseNew ZealanderNicaraguanNigerianNorthern EuropeanNorwegianOkinawanOsageOttawaPaiutePakistaniPalestinianPanamanianParaguayanPennsylvania GermanPeruvianPimaPolishPortuguesePotawatomiPuebloPuerto RicanPuget Sound SalishRomanianRussianSalvadoranSamoanScandinavianScotch-IrishScottishSeminoleSenegaleseSerbianShoshoneSierra LeoneanSiouxSlavicSlovakSloveneSomaliSouth AfricanSouth AmericanSouth American IndianSoviet UnionSpaniardSpanishSpanish AmericanSpanish American IndianSri LankanSubsaharan AfricanSudaneseSwedishSwissSyrianTaiwaneseThaiTlingit-HaidaTohono O'OdhamTonganTrinidadian and TobagonianTsimshianTurkishU.S. Virgin IslanderUgandanUkrainianUruguayanUteVenezuelanVietnameseWelshWest IndianYakamaYaquiYugoslavianYumanYup'ikZimbabwean
Immigration
NonimmigrantsImmigrantsAfghanistanAfricaAlbaniaArgentinaArmeniaAsiaAustraliaAustriaBahamasBangladeshBarbadosBelarusBelgiumBelizeBoliviaBosnia and HerzegovinaBrazilBulgariaBurma/MyanmarCabo VerdeCambodiaCameroonCanadaCaribbeanCentral AmericaChileChinaColombiaCongoCosta RicaCroatiaCubaCzechoslovakiaDenmarkDominicaDominican RepublicEastern AfricaEastern AsiaEastern EuropeEcuadorEgyptEl SalvadorEnglandEritreaEthiopiaEuropeFijiFranceGermanyGhanaGreeceGrenadaGuatemalaGuyanaHaitiHondurasHong KongHungaryIndiaIndonesiaIranIraqIrelandIsraelItalyJamaicaJapanJordanKazakhstanKenyaKoreaKuwaitLaosLatin AmericaLatviaLebanonLiberiaLithuaniaMalaysiaMexicoMicronesiaMiddle AfricaMoldovaMoroccoNepalNetherlandsNicaraguaNigeriaNorth AmericaNorth MacedoniaNorthern AfricaNorthern EuropeNorwayOceaniaPakistanPanamaPeruPhilippinesPolandPortugalRomaniaRussiaSaudi ArabiaScotlandSenegalSerbiaSierra LeoneSingaporeSomaliaSouth AfricaSouth AmericaSouth Central AsiaSouth Eastern AsiaSouthern EuropeSpainSri LankaSt. Vincent and the GrenadinesSudanSwedenSwitzerlandSyriaTaiwanThailandTrinidad and TobagoTurkeyUgandaUkraineUruguayUzbekistanVenezuelaVietnamWest IndiesWestern AfricaWestern AsiaWestern EuropeYemenZaireZimbabweAzores
Select to Compare
Race
Ancestry
AfghanAfricanAlaska NativeAlaskan AthabascanAlbanianAleutAlsatianAmericanApacheArabArapahoArgentineanArmenianAssyrian/Chaldean/SyriacAustralianAustrianBahamianBangladeshiBarbadianBasqueBelgianBelizeanBermudanBhutaneseBlackfeetBolivianBrazilianBritishBritish West IndianBulgarianBurmeseCajunCambodianCanadianCape VerdeanCarpatho RusynCelticCentral AmericanCentral American IndianCherokeeCheyenneChickasawChileanChineseChippewaChoctawColombianColvilleComancheCosta RicanCreeCreekCroatianCrowCubanCypriotCzechCzechoslovakianDanishDelawareDominicanDutchDutch West IndianEastern EuropeanEcuadorianEgyptianEnglishEstonianEthiopianEuropeanFijianFilipinoFinnishFrenchFrench American IndianFrench CanadianGermanGerman RussianGhanaianGreekGuamanian/ChamorroGuatemalanGuyaneseHaitianHmongHonduranHopiHoumaHungarianIcelanderIndian (Asian)IndonesianInupiatIranianIraqiIrishIroquoisIsraeliItalianJamaicanJapaneseJordanianKenyanKiowaKoreanLaotianLatvianLebaneseLiberianLithuanianLumbeeLuxembourgerMacedonianMalaysianMalteseMarshalleseMenomineeMexicanMexican American IndianMongolianMoroccanNative HawaiianNavajoNepaleseNew ZealanderNicaraguanNigerianNorthern EuropeanNorwegianOkinawanOsageOttawaPaiutePakistaniPalestinianPanamanianParaguayanPennsylvania GermanPeruvianPimaPolishPortuguesePotawatomiPuebloPuerto RicanPuget Sound SalishRomanianRussianSalvadoranSamoanScandinavianScotch-IrishScottishSeminoleSenegaleseSerbianSierra LeoneanSiouxSlavicSlovakSloveneSomaliSouth AfricanSouth AmericanSouth American IndianSoviet UnionSpaniardSpanishSpanish AmericanSpanish American IndianSri LankanSubsaharan AfricanSudaneseSwedishSwissSyrianTaiwaneseThaiTlingit-HaidaTohono O'OdhamTonganTrinidadian and TobagonianTsimshianTurkishU.S. Virgin IslanderUgandanUkrainianUruguayanUteVenezuelanVietnameseWelshWest IndianYakamaYaquiYugoslavianYumanYup'ikZimbabwean
Immigration
NonimmigrantsImmigrantsAfghanistanAfricaAlbaniaArgentinaArmeniaAsiaAustraliaAustriaBahamasBangladeshBarbadosBelarusBelgiumBelizeBoliviaBosnia and HerzegovinaBrazilBulgariaBurma/MyanmarCabo VerdeCambodiaCameroonCanadaCaribbeanCentral AmericaChileChinaColombiaCongoCosta RicaCroatiaCubaCzechoslovakiaDenmarkDominicaDominican RepublicEastern AfricaEastern AsiaEastern EuropeEcuadorEgyptEl SalvadorEnglandEritreaEthiopiaEuropeFijiFranceGermanyGhanaGreeceGrenadaGuatemalaGuyanaHaitiHondurasHong KongHungaryIndiaIndonesiaIranIraqIrelandIsraelItalyJamaicaJapanJordanKazakhstanKenyaKoreaKuwaitLaosLatin AmericaLatviaLebanonLiberiaLithuaniaMalaysiaMexicoMicronesiaMiddle AfricaMoldovaMoroccoNepalNetherlandsNicaraguaNigeriaNorth AmericaNorth MacedoniaNorthern AfricaNorthern EuropeNorwayOceaniaPakistanPanamaPeruPhilippinesPolandPortugalRomaniaRussiaSaudi ArabiaScotlandSenegalSerbiaSierra LeoneSingaporeSomaliaSouth AfricaSouth AmericaSouth Central AsiaSouth Eastern AsiaSouthern EuropeSpainSri LankaSt. Vincent and the GrenadinesSudanSwedenSwitzerlandSyriaTaiwanThailandTrinidad and TobagoTurkeyUgandaUkraineUruguayUzbekistanVenezuelaVietnamWest IndiesWestern AfricaWestern AsiaWestern EuropeYemenZaireZimbabweAzores
Married-Couple Family Poverty
Income
Poverty
Unemployment
Labor Participation
Family Structure
Vehicle Availability
Education Level
Disability

Shoshone Married-Couple Family Poverty
Tragic

6.1%
POVERTY | MARRIED-COUPLE FAMILIES
0.3/ 100
METRIC RATING
262nd/ 347
METRIC RANK

Shoshone Married-Couple Family Poverty Correlation Chart

The statistical analysis conducted on geographies consisting of 66,505,445 people shows a very strong positive correlation between the proportion of Shoshone and poverty level among married-couple families in the United States with a correlation coefficient (R) of 0.805 and weighted average of 6.1%. On average, for every 1% (one percent) increase in Shoshone within a typical geography, there is an increase of 0.35% in poverty level among married-couple families.
Shoshone Married-Couple Family Poverty
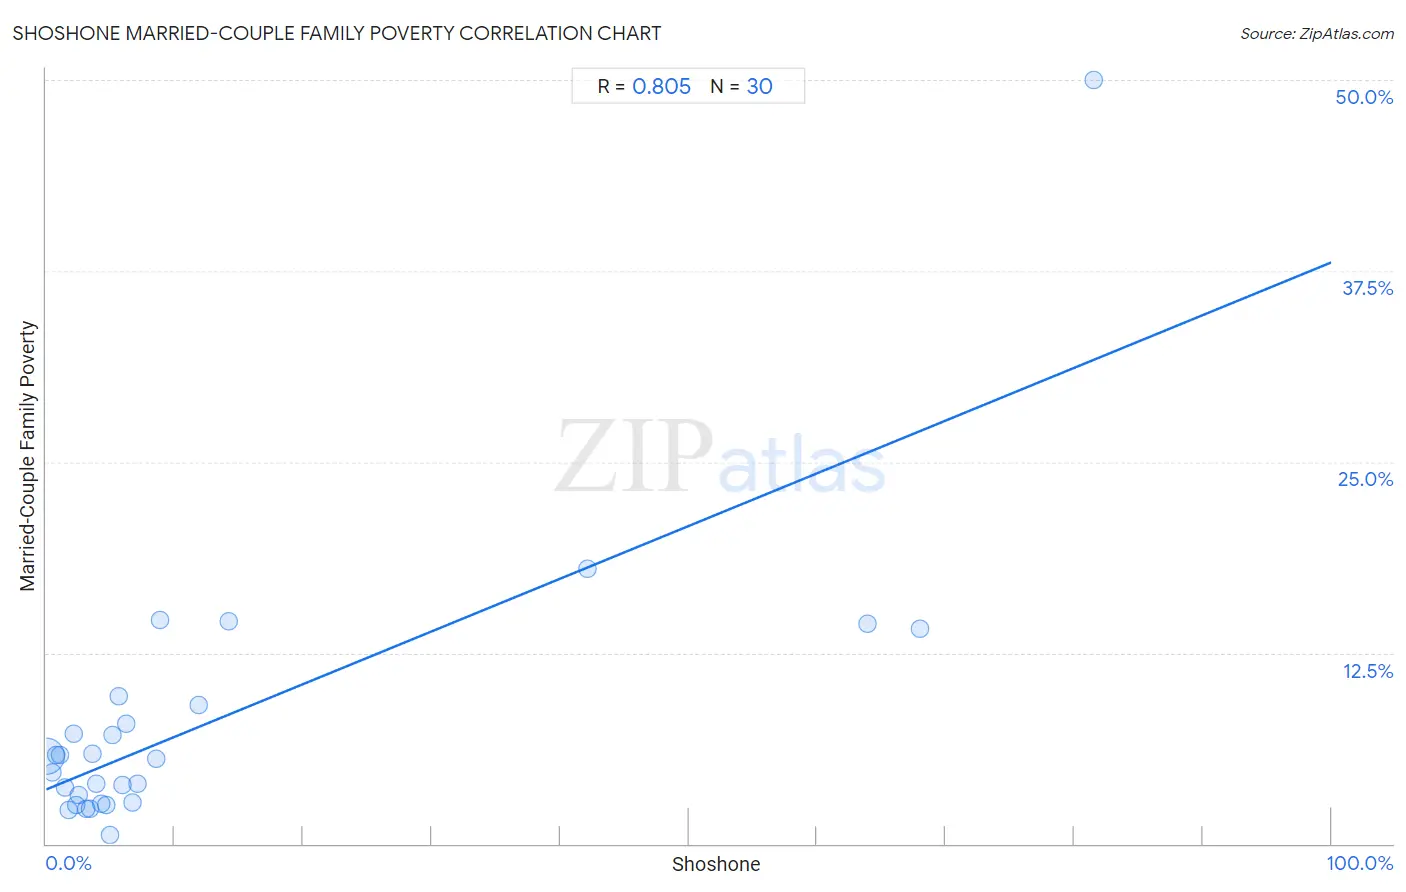
It is essential to understand that the correlation between the percentage of Shoshone and poverty level among married-couple families does not imply a direct cause-and-effect relationship. It remains uncertain whether the presence of Shoshone influences an upward or downward trend in the level of poverty level among married-couple families within an area, or if Shoshone simply ended up residing in those areas with higher or lower levels of poverty level among married-couple families due to other factors.

Demographics Similar to Shoshone by Married-Couple Family Poverty

In terms of married-couple family poverty, the demographic groups most similar to Shoshone are Senegalese (6.1%, a difference of 0.21%), Immigrants from Senegal (6.1%, a difference of 0.39%), Jamaican (6.1%, a difference of 0.40%), Alaskan Athabascan (6.1%, a difference of 0.61%), and Immigrants from Congo (6.1%, a difference of 0.62%).
DemographicsRating | RankMarried-Couple Family Poverty
Comanche
0.7
/100
|
#255
Tragic
6.0%
Bangladeshis
0.5
/100
|
#256
Tragic
6.0%
Immigrants from Burma/Myanmar
0.5
/100
|
#257
Tragic
6.0%
Immigrants
0.5
/100
|
#258
Tragic
6.0%
Alaskan Athabascans
0.4
/100
|
#259
Tragic
6.1%
Jamaicans
0.3
/100
|
#260
Tragic
6.1%
Senegalese
0.3
/100
|
#261
Tragic
6.1%
Shoshone
0.3
/100
|
#262
Tragic
6.1%
Immigrants from Senegal
0.3
/100
|
#263
Tragic
6.1%
Immigrants from Congo
0.2
/100
|
#264
Tragic
6.1%
Blackfeet
0.2
/100
|
#265
Tragic
6.2%
Creek
0.2
/100
|
#266
Tragic
6.2%
Spanish Americans
0.2
/100
|
#267
Tragic
6.2%
Alaska Natives
0.2
/100
|
#268
Tragic
6.2%
Immigrants from West Indies
0.1
/100
|
#269
Tragic
6.2%

Shoshone Married-Couple Family Poverty Correlation Summary

MeasurementShoshone DataMarried-Couple Family Poverty Data
Minimum0.025%0.60%
Maximum81.5%50.0%
Range81.5%49.4%
Mean12.5%7.9%
Median4.9%5.6%
Interquartile 25% (IQ1)2.4%2.7%
Interquartile 75% (IQ3)8.5%9.1%
Interquartile Range (IQR)6.1%6.4%
Standard Deviation (Sample)21.4%9.2%
Standard Deviation (Population)21.0%9.0%

Correlation Details

Shoshone PercentileSample SizeMarried-Couple Family Poverty
[
0.0%
-
0.5%
]
0.025%
65,310,6955.7%
[
0.0%
-
0.5%
]
0.47%
653,7104.7%
[
0.5%
-
1.0%
]
0.76%
272,4495.8%
[
1.0%
-
1.5%
]
1.07%
62,1005.8%
[
1.0%
-
1.5%
]
1.45%
73,0673.7%
[
1.5%
-
2.0%
]
1.71%
9,5082.2%
[
2.0%
-
2.5%
]
2.12%
2,5517.2%
[
2.0%
-
2.5%
]
2.37%
31,8452.6%
[
2.5%
-
3.0%
]
2.56%
1,3303.2%
[
3.0%
-
3.5%
]
3.08%
13,2252.3%
[
3.0%
-
3.5%
]
3.39%
28,5682.3%
[
3.5%
-
4.0%
]
3.61%
1,1075.9%
[
3.5%
-
4.0%
]
3.91%
8453.9%
[
4.0%
-
4.5%
]
4.33%
2,1492.6%
[
4.5%
-
5.0%
]
4.70%
3,9572.5%
[
5.0%
-
5.5%
]
5.00%
5200.60%
[
5.0%
-
5.5%
]
5.16%
3,4907.1%
[
5.5%
-
6.0%
]
5.63%
1,3509.6%
[
5.5%
-
6.0%
]
5.96%
7,2123.8%
[
6.0%
-
6.5%
]
6.21%
2907.8%
[
6.5%
-
7.0%
]
6.68%
13,9892.7%
[
7.0%
-
7.5%
]
7.11%
8024.0%
[
8.5%
-
9.0%
]
8.51%
2,6085.6%
[
8.5%
-
9.0%
]
8.83%
2,26514.7%
[
11.5%
-
12.0%
]
11.83%
1,4719.1%
[
14.0%
-
14.5%
]
14.21%
60514.6%
[
42.0%
-
42.5%
]
42.11%
51318.0%
[
63.5%
-
64.0%
]
63.88%
1,48114.4%
[
68.0%
-
68.5%
]
68.00%
1,59714.1%
[
81.5%
-
82.0%
]
81.51%
14650.0%