Immigrants from South Africa Married-Couple Family Poverty
COMPARE
Immigrants from South Africa
Select to Compare
Married-Couple Family Poverty
Immigrants from South Africa Married-Couple Family Poverty
4.5%
POVERTY | MARRIED-COUPLE FAMILIES
99.1/ 100
METRIC RATING
76th/ 347
METRIC RANK
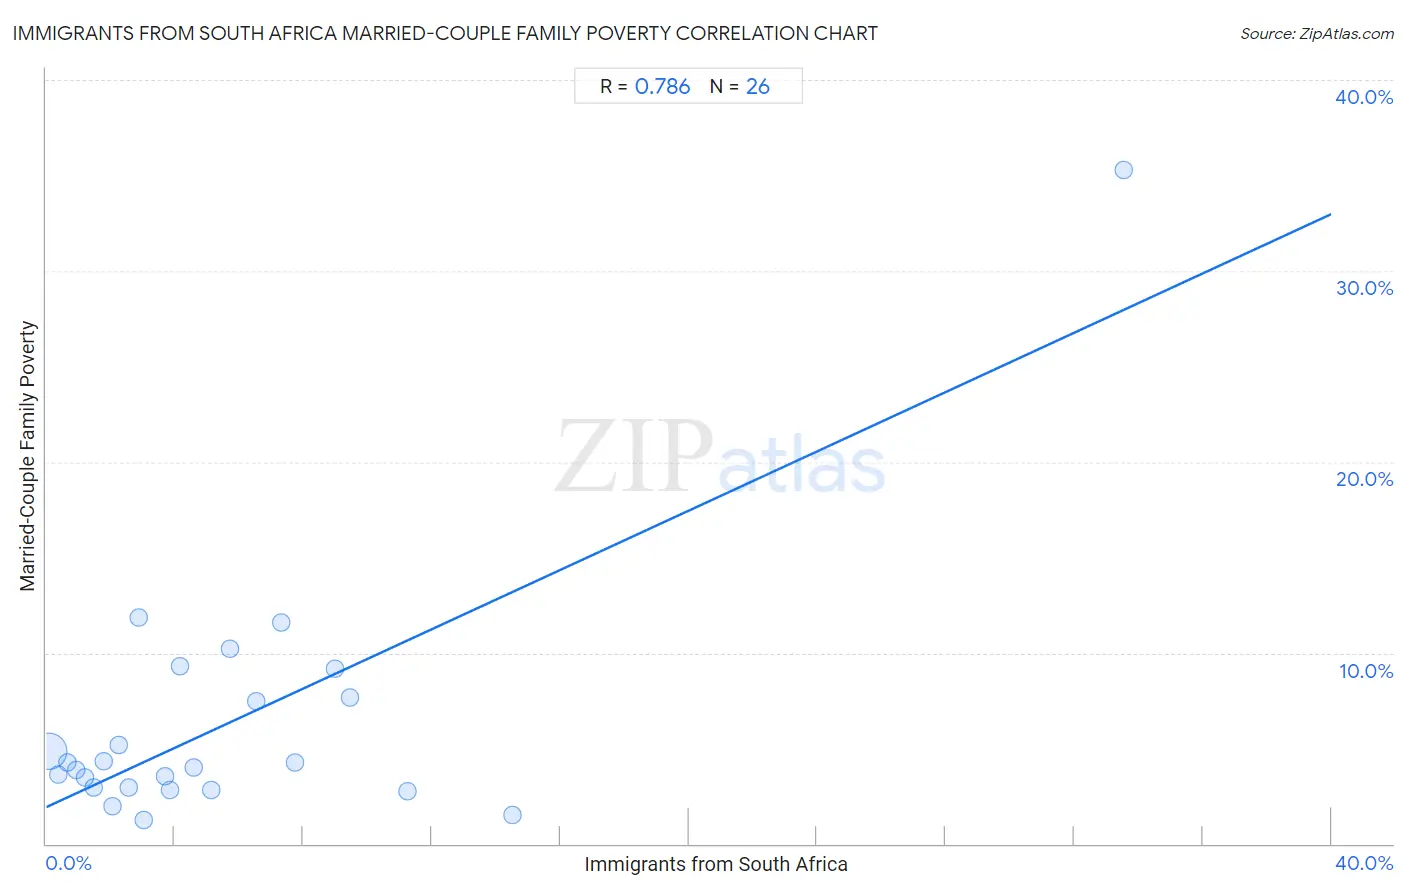
Immigrants from South Africa Married-Couple Family Poverty Correlation Chart
The statistical analysis conducted on geographies consisting of 231,973,185 people shows a strong positive correlation between the proportion of Immigrants from South Africa and poverty level among married-couple families in the United States with a correlation coefficient (R) of 0.786 and weighted average of 4.5%. On average, for every 1% (one percent) increase in Immigrants from South Africa within a typical geography, there is an increase of 0.78% in poverty level among married-couple families.
It is essential to understand that the correlation between the percentage of Immigrants from South Africa and poverty level among married-couple families does not imply a direct cause-and-effect relationship. It remains uncertain whether the presence of Immigrants from South Africa influences an upward or downward trend in the level of poverty level among married-couple families within an area, or if Immigrants from South Africa simply ended up residing in those areas with higher or lower levels of poverty level among married-couple families due to other factors.
Demographics Similar to Immigrants from South Africa by Married-Couple Family Poverty
In terms of married-couple family poverty, the demographic groups most similar to Immigrants from South Africa are Cambodian (4.5%, a difference of 0.11%), Immigrants from Latvia (4.5%, a difference of 0.17%), Scotch-Irish (4.5%, a difference of 0.25%), Immigrants from Austria (4.5%, a difference of 0.38%), and Ukrainian (4.5%, a difference of 0.48%).
| Demographics | Rating | Rank | Married-Couple Family Poverty |
| New Zealanders | 99.4 /100 | #69 | Exceptional 4.4% |
| Immigrants from Korea | 99.4 /100 | #70 | Exceptional 4.5% |
| Immigrants from North America | 99.3 /100 | #71 | Exceptional 4.5% |
| Immigrants from England | 99.3 /100 | #72 | Exceptional 4.5% |
| Ukrainians | 99.2 /100 | #73 | Exceptional 4.5% |
| Immigrants from Austria | 99.2 /100 | #74 | Exceptional 4.5% |
| Cambodians | 99.2 /100 | #75 | Exceptional 4.5% |
| Immigrants from South Africa | 99.1 /100 | #76 | Exceptional 4.5% |
| Immigrants from Latvia | 99.1 /100 | #77 | Exceptional 4.5% |
| Scotch-Irish | 99.1 /100 | #78 | Exceptional 4.5% |
| Immigrants from Iran | 99.0 /100 | #79 | Exceptional 4.5% |
| Icelanders | 99.0 /100 | #80 | Exceptional 4.5% |
| Immigrants from Greece | 98.9 /100 | #81 | Exceptional 4.5% |
| Canadians | 98.8 /100 | #82 | Exceptional 4.5% |
| Immigrants from Denmark | 98.8 /100 | #83 | Exceptional 4.6% |
Immigrants from South Africa Married-Couple Family Poverty Correlation Summary
| Measurement | Immigrants from South Africa Data | Married-Couple Family Poverty Data |
| Minimum | 0.064% | 1.2% |
| Maximum | 33.5% | 35.3% |
| Range | 33.5% | 34.1% |
| Mean | 5.6% | 6.3% |
| Median | 3.8% | 4.1% |
| Interquartile 25% (IQ1) | 1.8% | 2.9% |
| Interquartile 75% (IQ3) | 7.3% | 7.7% |
| Interquartile Range (IQR) | 5.5% | 4.8% |
| Standard Deviation (Sample) | 6.7% | 6.7% |
| Standard Deviation (Population) | 6.6% | 6.5% |
Correlation Details
| Immigrants from South Africa Percentile | Sample Size | Married-Couple Family Poverty |
[ 0.0% - 0.5% ] 0.064% | 219,152,629 | 4.8% |
[ 0.0% - 0.5% ] 0.37% | 9,984,062 | 3.6% |
[ 0.5% - 1.0% ] 0.66% | 1,428,096 | 4.2% |
[ 0.5% - 1.0% ] 0.93% | 742,949 | 3.9% |
[ 1.0% - 1.5% ] 1.22% | 288,228 | 3.5% |
[ 1.0% - 1.5% ] 1.48% | 197,197 | 2.9% |
[ 1.5% - 2.0% ] 1.79% | 26,408 | 4.3% |
[ 2.0% - 2.5% ] 2.04% | 38,791 | 2.0% |
[ 2.0% - 2.5% ] 2.25% | 21,233 | 5.2% |
[ 2.5% - 3.0% ] 2.58% | 16,492 | 2.9% |
[ 2.5% - 3.0% ] 2.87% | 6,591 | 11.9% |
[ 3.0% - 3.5% ] 3.05% | 27,593 | 1.2% |
[ 3.5% - 4.0% ] 3.68% | 3,912 | 3.5% |
[ 3.5% - 4.0% ] 3.84% | 25,869 | 2.8% |
[ 4.0% - 4.5% ] 4.17% | 1,533 | 9.3% |
[ 4.5% - 5.0% ] 4.58% | 153 | 4.0% |
[ 5.0% - 5.5% ] 5.12% | 683 | 2.8% |
[ 5.5% - 6.0% ] 5.72% | 367 | 10.2% |
[ 6.5% - 7.0% ] 6.53% | 3,908 | 7.5% |
[ 7.0% - 7.5% ] 7.32% | 3,484 | 11.6% |
[ 7.5% - 8.0% ] 7.74% | 969 | 4.3% |
[ 9.0% - 9.5% ] 9.01% | 744 | 9.2% |
[ 9.0% - 9.5% ] 9.47% | 190 | 7.7% |
[ 11.0% - 11.5% ] 11.26% | 435 | 2.8% |
[ 14.5% - 15.0% ] 14.52% | 496 | 1.5% |
[ 33.5% - 34.0% ] 33.53% | 173 | 35.3% |