Immigrants from Korea Married-Couple Family Poverty
COMPARE
Immigrants from Korea
Select to Compare
Married-Couple Family Poverty
Immigrants from Korea Married-Couple Family Poverty
4.5%
POVERTY | MARRIED-COUPLE FAMILIES
99.4/ 100
METRIC RATING
70th/ 347
METRIC RANK
Immigrants from Korea Married-Couple Family Poverty Correlation Chart
The statistical analysis conducted on geographies consisting of 411,729,452 people shows a slight positive correlation between the proportion of Immigrants from Korea and poverty level among married-couple families in the United States with a correlation coefficient (R) of 0.080 and weighted average of 4.5%. On average, for every 1% (one percent) increase in Immigrants from Korea within a typical geography, there is an increase of 0.030% in poverty level among married-couple families.
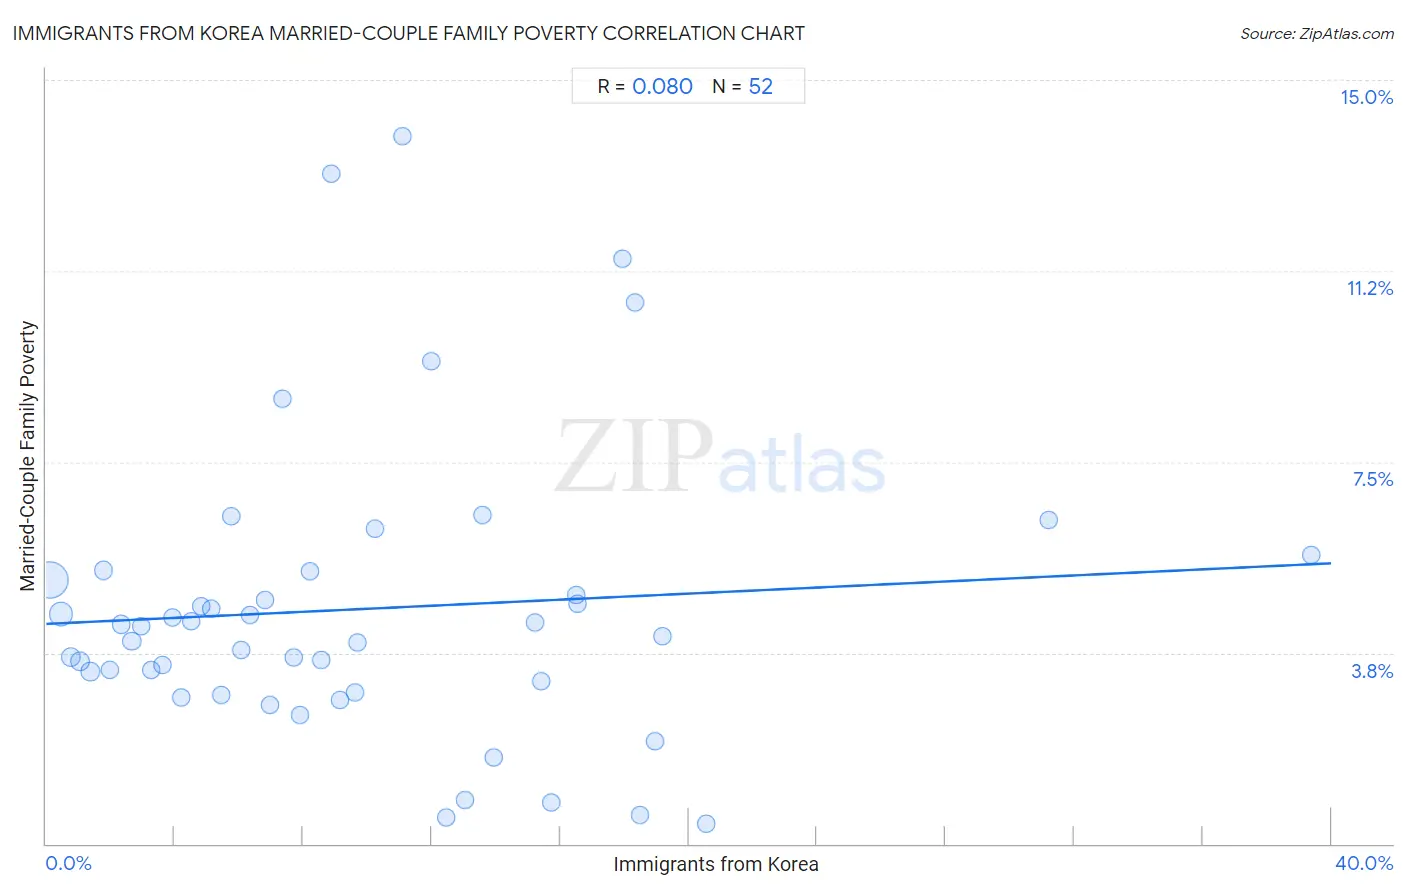
It is essential to understand that the correlation between the percentage of Immigrants from Korea and poverty level among married-couple families does not imply a direct cause-and-effect relationship. It remains uncertain whether the presence of Immigrants from Korea influences an upward or downward trend in the level of poverty level among married-couple families within an area, or if Immigrants from Korea simply ended up residing in those areas with higher or lower levels of poverty level among married-couple families due to other factors.
Demographics Similar to Immigrants from Korea by Married-Couple Family Poverty
In terms of married-couple family poverty, the demographic groups most similar to Immigrants from Korea are New Zealander (4.4%, a difference of 0.13%), Slavic (4.4%, a difference of 0.14%), Immigrants from Canada (4.4%, a difference of 0.16%), Immigrants from Serbia (4.4%, a difference of 0.20%), and Macedonian (4.4%, a difference of 0.34%).
| Demographics | Rating | Rank | Married-Couple Family Poverty |
| Immigrants from Sri Lanka | 99.6 /100 | #63 | Exceptional 4.4% |
| Immigrants from Bulgaria | 99.5 /100 | #64 | Exceptional 4.4% |
| Macedonians | 99.4 /100 | #65 | Exceptional 4.4% |
| Immigrants from Serbia | 99.4 /100 | #66 | Exceptional 4.4% |
| Immigrants from Canada | 99.4 /100 | #67 | Exceptional 4.4% |
| Slavs | 99.4 /100 | #68 | Exceptional 4.4% |
| New Zealanders | 99.4 /100 | #69 | Exceptional 4.4% |
| Immigrants from Korea | 99.4 /100 | #70 | Exceptional 4.5% |
| Immigrants from North America | 99.3 /100 | #71 | Exceptional 4.5% |
| Immigrants from England | 99.3 /100 | #72 | Exceptional 4.5% |
| Ukrainians | 99.2 /100 | #73 | Exceptional 4.5% |
| Immigrants from Austria | 99.2 /100 | #74 | Exceptional 4.5% |
| Cambodians | 99.2 /100 | #75 | Exceptional 4.5% |
| Immigrants from South Africa | 99.1 /100 | #76 | Exceptional 4.5% |
| Immigrants from Latvia | 99.1 /100 | #77 | Exceptional 4.5% |
Immigrants from Korea Married-Couple Family Poverty Correlation Summary
| Measurement | Immigrants from Korea Data | Married-Couple Family Poverty Data |
| Minimum | 0.13% | 0.39% |
| Maximum | 39.4% | 13.9% |
| Range | 39.3% | 13.5% |
| Mean | 9.8% | 4.6% |
| Median | 8.1% | 4.2% |
| Interquartile 25% (IQ1) | 4.1% | 3.1% |
| Interquartile 75% (IQ3) | 14.6% | 5.3% |
| Interquartile Range (IQR) | 10.5% | 2.2% |
| Standard Deviation (Sample) | 7.8% | 2.9% |
| Standard Deviation (Population) | 7.7% | 2.9% |
Correlation Details
| Immigrants from Korea Percentile | Sample Size | Married-Couple Family Poverty |
[ 0.0% - 0.5% ] 0.13% | 260,450,697 | 5.2% |
[ 0.0% - 0.5% ] 0.45% | 77,229,452 | 4.5% |
[ 0.5% - 1.0% ] 0.76% | 28,857,705 | 3.7% |
[ 1.0% - 1.5% ] 1.07% | 15,527,206 | 3.6% |
[ 1.0% - 1.5% ] 1.37% | 7,506,021 | 3.4% |
[ 1.5% - 2.0% ] 1.78% | 7,572,658 | 5.4% |
[ 1.5% - 2.0% ] 1.99% | 3,065,477 | 3.4% |
[ 2.0% - 2.5% ] 2.32% | 1,866,105 | 4.3% |
[ 2.5% - 3.0% ] 2.66% | 1,681,150 | 4.0% |
[ 2.5% - 3.0% ] 2.96% | 1,367,838 | 4.3% |
[ 3.0% - 3.5% ] 3.28% | 949,679 | 3.4% |
[ 3.5% - 4.0% ] 3.60% | 587,757 | 3.5% |
[ 3.5% - 4.0% ] 3.93% | 449,566 | 4.5% |
[ 4.0% - 4.5% ] 4.20% | 450,848 | 2.9% |
[ 4.5% - 5.0% ] 4.51% | 573,799 | 4.4% |
[ 4.5% - 5.0% ] 4.83% | 482,992 | 4.7% |
[ 5.0% - 5.5% ] 5.12% | 202,500 | 4.6% |
[ 5.0% - 5.5% ] 5.45% | 213,362 | 2.9% |
[ 5.5% - 6.0% ] 5.76% | 256,515 | 6.4% |
[ 6.0% - 6.5% ] 6.05% | 184,026 | 3.8% |
[ 6.0% - 6.5% ] 6.33% | 193,464 | 4.5% |
[ 6.5% - 7.0% ] 6.79% | 162,270 | 4.8% |
[ 6.5% - 7.0% ] 6.96% | 87,910 | 2.7% |
[ 7.0% - 7.5% ] 7.37% | 93,669 | 8.7% |
[ 7.5% - 8.0% ] 7.69% | 222,803 | 3.7% |
[ 7.5% - 8.0% ] 7.91% | 170,007 | 2.5% |
[ 8.0% - 8.5% ] 8.21% | 238,163 | 5.3% |
[ 8.5% - 9.0% ] 8.56% | 189,409 | 3.6% |
[ 8.5% - 9.0% ] 8.85% | 148,339 | 13.2% |
[ 9.0% - 9.5% ] 9.16% | 51,969 | 2.8% |
[ 9.5% - 10.0% ] 9.63% | 27,788 | 3.0% |
[ 9.5% - 10.0% ] 9.69% | 98,267 | 3.9% |
[ 10.0% - 10.5% ] 10.25% | 37,735 | 6.2% |
[ 11.0% - 11.5% ] 11.09% | 56,628 | 13.9% |
[ 11.5% - 12.0% ] 11.98% | 9,273 | 9.5% |
[ 12.0% - 12.5% ] 12.46% | 30,598 | 0.51% |
[ 13.0% - 13.5% ] 13.02% | 10,694 | 0.86% |
[ 13.5% - 14.0% ] 13.57% | 36,151 | 6.5% |
[ 13.5% - 14.0% ] 13.94% | 48,796 | 1.7% |
[ 15.0% - 15.5% ] 15.20% | 52,799 | 4.4% |
[ 15.0% - 15.5% ] 15.40% | 5,336 | 3.2% |
[ 15.5% - 16.0% ] 15.71% | 18,210 | 0.81% |
[ 16.0% - 16.5% ] 16.50% | 39,799 | 4.9% |
[ 16.5% - 17.0% ] 16.52% | 44,550 | 4.7% |
[ 17.5% - 18.0% ] 17.93% | 37,754 | 11.5% |
[ 18.0% - 18.5% ] 18.33% | 38,400 | 10.6% |
[ 18.0% - 18.5% ] 18.50% | 18,564 | 0.57% |
[ 18.5% - 19.0% ] 18.97% | 5,863 | 2.0% |
[ 19.0% - 19.5% ] 19.20% | 22,930 | 4.1% |
[ 20.5% - 21.0% ] 20.56% | 11,314 | 0.39% |
[ 31.0% - 31.5% ] 31.21% | 4,185 | 6.4% |
[ 39.0% - 39.5% ] 39.39% | 40,462 | 5.7% |