Iranian Married-Couple Family Poverty

COMPARE

Iranian
Race
Ancestry
AfghanAfricanAlaska NativeAlaskan AthabascanAlbanianAleutAlsatianAmericanApacheArabArapahoArgentineanArmenianAssyrian/Chaldean/SyriacAustralianAustrianBahamianBangladeshiBarbadianBasqueBelgianBelizeanBermudanBhutaneseBlackfeetBolivianBrazilianBritishBritish West IndianBulgarianBurmeseCajunCambodianCanadianCape VerdeanCarpatho RusynCelticCentral AmericanCentral American IndianCherokeeCheyenneChickasawChileanChineseChippewaChoctawColombianColvilleComancheCosta RicanCreeCreekCroatianCrowCubanCypriotCzechCzechoslovakianDanishDelawareDominicanDutchDutch West IndianEastern EuropeanEcuadorianEgyptianEnglishEstonianEthiopianEuropeanFijianFilipinoFinnishFrenchFrench American IndianFrench CanadianGermanGerman RussianGhanaianGreekGuamanian/ChamorroGuatemalanGuyaneseHaitianHmongHonduranHopiHoumaHungarianIcelanderIndian (Asian)IndonesianInupiatIranianIraqiIrishIroquoisIsraeliItalianJamaicanJapaneseJordanianKenyanKiowaKoreanLaotianLatvianLebaneseLiberianLithuanianLumbeeLuxembourgerMacedonianMalaysianMalteseMarshalleseMenomineeMexicanMexican American IndianMongolianMoroccanNative HawaiianNavajoNepaleseNew ZealanderNicaraguanNigerianNorthern EuropeanNorwegianOkinawanOsageOttawaPaiutePakistaniPalestinianPanamanianParaguayanPennsylvania GermanPeruvianPimaPolishPortuguesePotawatomiPuebloPuerto RicanPuget Sound SalishRomanianRussianSalvadoranSamoanScandinavianScotch-IrishScottishSeminoleSenegaleseSerbianShoshoneSierra LeoneanSiouxSlavicSlovakSloveneSomaliSouth AfricanSouth AmericanSouth American IndianSoviet UnionSpaniardSpanishSpanish AmericanSpanish American IndianSri LankanSubsaharan AfricanSudaneseSwedishSwissSyrianTaiwaneseThaiTlingit-HaidaTohono O'OdhamTonganTrinidadian and TobagonianTsimshianTurkishU.S. Virgin IslanderUgandanUkrainianUruguayanUteVenezuelanVietnameseWelshWest IndianYakamaYaquiYugoslavianYumanYup'ikZimbabwean
Immigration
NonimmigrantsImmigrantsAfghanistanAfricaAlbaniaArgentinaArmeniaAsiaAustraliaAustriaBahamasBangladeshBarbadosBelarusBelgiumBelizeBoliviaBosnia and HerzegovinaBrazilBulgariaBurma/MyanmarCabo VerdeCambodiaCameroonCanadaCaribbeanCentral AmericaChileChinaColombiaCongoCosta RicaCroatiaCubaCzechoslovakiaDenmarkDominicaDominican RepublicEastern AfricaEastern AsiaEastern EuropeEcuadorEgyptEl SalvadorEnglandEritreaEthiopiaEuropeFijiFranceGermanyGhanaGreeceGrenadaGuatemalaGuyanaHaitiHondurasHong KongHungaryIndiaIndonesiaIranIraqIrelandIsraelItalyJamaicaJapanJordanKazakhstanKenyaKoreaKuwaitLaosLatin AmericaLatviaLebanonLiberiaLithuaniaMalaysiaMexicoMicronesiaMiddle AfricaMoldovaMoroccoNepalNetherlandsNicaraguaNigeriaNorth AmericaNorth MacedoniaNorthern AfricaNorthern EuropeNorwayOceaniaPakistanPanamaPeruPhilippinesPolandPortugalRomaniaRussiaSaudi ArabiaScotlandSenegalSerbiaSierra LeoneSingaporeSomaliaSouth AfricaSouth AmericaSouth Central AsiaSouth Eastern AsiaSouthern EuropeSpainSri LankaSt. Vincent and the GrenadinesSudanSwedenSwitzerlandSyriaTaiwanThailandTrinidad and TobagoTurkeyUgandaUkraineUruguayUzbekistanVenezuelaVietnamWest IndiesWestern AfricaWestern AsiaWestern EuropeYemenZaireZimbabweAzores
Select to Compare
Race
Ancestry
AfghanAfricanAlaska NativeAlaskan AthabascanAlbanianAleutAlsatianAmericanApacheArabArapahoArgentineanArmenianAssyrian/Chaldean/SyriacAustralianAustrianBahamianBangladeshiBarbadianBasqueBelgianBelizeanBermudanBhutaneseBlackfeetBolivianBrazilianBritishBritish West IndianBulgarianBurmeseCajunCambodianCanadianCape VerdeanCarpatho RusynCelticCentral AmericanCentral American IndianCherokeeCheyenneChickasawChileanChineseChippewaChoctawColombianColvilleComancheCosta RicanCreeCreekCroatianCrowCubanCypriotCzechCzechoslovakianDanishDelawareDominicanDutchDutch West IndianEastern EuropeanEcuadorianEgyptianEnglishEstonianEthiopianEuropeanFijianFilipinoFinnishFrenchFrench American IndianFrench CanadianGermanGerman RussianGhanaianGreekGuamanian/ChamorroGuatemalanGuyaneseHaitianHmongHonduranHopiHoumaHungarianIcelanderIndian (Asian)IndonesianInupiatIraqiIrishIroquoisIsraeliItalianJamaicanJapaneseJordanianKenyanKiowaKoreanLaotianLatvianLebaneseLiberianLithuanianLumbeeLuxembourgerMacedonianMalaysianMalteseMarshalleseMenomineeMexicanMexican American IndianMongolianMoroccanNative HawaiianNavajoNepaleseNew ZealanderNicaraguanNigerianNorthern EuropeanNorwegianOkinawanOsageOttawaPaiutePakistaniPalestinianPanamanianParaguayanPennsylvania GermanPeruvianPimaPolishPortuguesePotawatomiPuebloPuerto RicanPuget Sound SalishRomanianRussianSalvadoranSamoanScandinavianScotch-IrishScottishSeminoleSenegaleseSerbianShoshoneSierra LeoneanSiouxSlavicSlovakSloveneSomaliSouth AfricanSouth AmericanSouth American IndianSoviet UnionSpaniardSpanishSpanish AmericanSpanish American IndianSri LankanSubsaharan AfricanSudaneseSwedishSwissSyrianTaiwaneseThaiTlingit-HaidaTohono O'OdhamTonganTrinidadian and TobagonianTsimshianTurkishU.S. Virgin IslanderUgandanUkrainianUruguayanUteVenezuelanVietnameseWelshWest IndianYakamaYaquiYugoslavianYumanYup'ikZimbabwean
Immigration
NonimmigrantsImmigrantsAfghanistanAfricaAlbaniaArgentinaArmeniaAsiaAustraliaAustriaBahamasBangladeshBarbadosBelarusBelgiumBelizeBoliviaBosnia and HerzegovinaBrazilBulgariaBurma/MyanmarCabo VerdeCambodiaCameroonCanadaCaribbeanCentral AmericaChileChinaColombiaCongoCosta RicaCroatiaCubaCzechoslovakiaDenmarkDominicaDominican RepublicEastern AfricaEastern AsiaEastern EuropeEcuadorEgyptEl SalvadorEnglandEritreaEthiopiaEuropeFijiFranceGermanyGhanaGreeceGrenadaGuatemalaGuyanaHaitiHondurasHong KongHungaryIndiaIndonesiaIranIraqIrelandIsraelItalyJamaicaJapanJordanKazakhstanKenyaKoreaKuwaitLaosLatin AmericaLatviaLebanonLiberiaLithuaniaMalaysiaMexicoMicronesiaMiddle AfricaMoldovaMoroccoNepalNetherlandsNicaraguaNigeriaNorth AmericaNorth MacedoniaNorthern AfricaNorthern EuropeNorwayOceaniaPakistanPanamaPeruPhilippinesPolandPortugalRomaniaRussiaSaudi ArabiaScotlandSenegalSerbiaSierra LeoneSingaporeSomaliaSouth AfricaSouth AmericaSouth Central AsiaSouth Eastern AsiaSouthern EuropeSpainSri LankaSt. Vincent and the GrenadinesSudanSwedenSwitzerlandSyriaTaiwanThailandTrinidad and TobagoTurkeyUgandaUkraineUruguayUzbekistanVenezuelaVietnamWest IndiesWestern AfricaWestern AsiaWestern EuropeYemenZaireZimbabweAzores
Married-Couple Family Poverty
Income
Poverty
Unemployment
Labor Participation
Family Structure
Vehicle Availability
Education Level
Disability

Iranian Married-Couple Family Poverty
Exceptional

4.3%
POVERTY | MARRIED-COUPLE FAMILIES
94.8/ 100
METRIC RATING
46th/ 347
METRIC RANK

Iranian Married-Couple Family Poverty Correlation Chart

The statistical analysis conducted on geographies consisting of 310,740,179 people shows a slight positive correlation between the proportion of Iranians and poverty level among married-couple families in the United States with a correlation coefficient (R) of 0.079 and weighted average of 4.3%. On average, for every 1% (one percent) increase in Iranians within a typical geography, there is an increase of 0.023% in poverty level among married-couple families.
Iranian Married-Couple Family Poverty
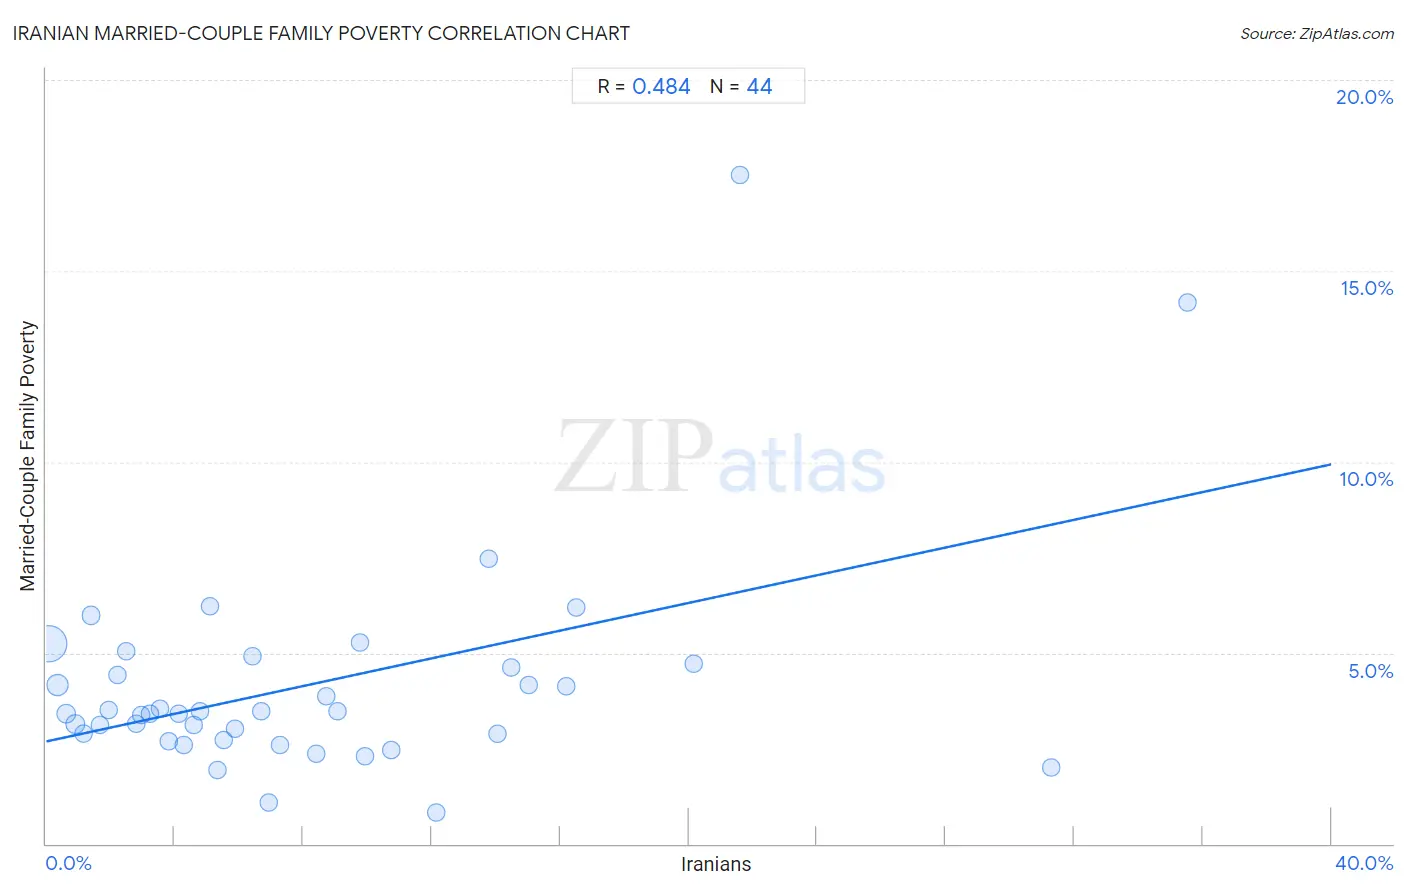
It is essential to understand that the correlation between the percentage of Iranians and poverty level among married-couple families does not imply a direct cause-and-effect relationship. It remains uncertain whether the presence of Iranians influences an upward or downward trend in the level of poverty level among married-couple families within an area, or if Iranians simply ended up residing in those areas with higher or lower levels of poverty level among married-couple families due to other factors.

Demographics Similar to Iranians by Married-Couple Family Poverty

In terms of married-couple family poverty, the demographic groups most similar to Iranians are Scottish (4.3%, a difference of 0.020%), Immigrants from Singapore (4.3%, a difference of 0.20%), Immigrants from Northern Europe (4.2%, a difference of 0.68%), Serbian (4.2%, a difference of 0.69%), and Immigrants from Japan (4.3%, a difference of 0.71%).
DemographicsRating | RankMarried-Couple Family Poverty
Dutch
95.2
/100
|
#39
Exceptional
4.2%
Tlingit-Haida
95.2
/100
|
#40
Exceptional
4.2%
English
95.1
/100
|
#41
Exceptional
4.2%
Estonians
95.1
/100
|
#42
Exceptional
4.2%
Europeans
95.1
/100
|
#43
Exceptional
4.2%
Serbians
95.0
/100
|
#44
Exceptional
4.2%
Immigrants from Northern Europe
95.0
/100
|
#45
Exceptional
4.2%
Iranians
94.8
/100
|
#46
Exceptional
4.3%
Scottish
94.8
/100
|
#47
Exceptional
4.3%
Immigrants from Singapore
94.7
/100
|
#48
Exceptional
4.3%
Immigrants from Japan
94.5
/100
|
#49
Exceptional
4.3%
Russians
94.5
/100
|
#50
Exceptional
4.3%
Czechoslovakians
94.5
/100
|
#51
Exceptional
4.3%
Swiss
94.4
/100
|
#52
Exceptional
4.3%
Immigrants from Netherlands
94.3
/100
|
#53
Exceptional
4.3%

Iranian Married-Couple Family Poverty Correlation Summary

MeasurementIranian DataMarried-Couple Family Poverty Data
Minimum0.096%1.2%
Maximum31.7%10.8%
Range31.6%9.6%
Mean7.1%3.8%
Median5.5%3.5%
Interquartile 25% (IQ1)2.6%2.7%
Interquartile 75% (IQ3)9.2%4.5%
Interquartile Range (IQR)6.6%1.8%
Standard Deviation (Sample)6.4%1.8%
Standard Deviation (Population)6.3%1.8%

Correlation Details

Iranian PercentileSample SizeMarried-Couple Family Poverty
[
0.0%
-
0.5%
]
0.096%
223,154,4515.4%
[
0.0%
-
0.5%
]
0.36%
46,240,7844.2%
[
0.5%
-
1.0%
]
0.62%
15,992,8013.4%
[
0.5%
-
1.0%
]
0.90%
7,928,1232.9%
[
1.0%
-
1.5%
]
1.11%
4,052,3463.2%
[
1.0%
-
1.5%
]
1.38%
6,267,4216.0%
[
1.5%
-
2.0%
]
1.63%
1,781,1083.2%
[
1.5%
-
2.0%
]
1.87%
1,028,1093.0%
[
2.0%
-
2.5%
]
2.15%
800,6804.4%
[
2.0%
-
2.5%
]
2.44%
405,7092.4%
[
2.5%
-
3.0%
]
2.65%
568,3224.7%
[
2.5%
-
3.0%
]
2.96%
411,6113.9%
[
3.0%
-
3.5%
]
3.21%
304,8852.5%
[
3.0%
-
3.5%
]
3.39%
453,7944.5%
[
3.5%
-
4.0%
]
3.70%
139,9072.7%
[
3.5%
-
4.0%
]
3.93%
65,3572.4%
[
4.0%
-
4.5%
]
4.14%
80,7992.2%
[
4.0%
-
4.5%
]
4.41%
126,6793.5%
[
4.5%
-
5.0%
]
4.66%
109,2293.5%
[
5.0%
-
5.5%
]
5.04%
31,2843.4%
[
5.0%
-
5.5%
]
5.22%
154,6403.6%
[
5.0%
-
5.5%
]
5.49%
13,9295.9%
[
5.5%
-
6.0%
]
5.84%
11,4292.7%
[
5.5%
-
6.0%
]
5.89%
111,0274.6%
[
6.0%
-
6.5%
]
6.30%
66,5511.9%
[
6.0%
-
6.5%
]
6.49%
35,8531.7%
[
6.5%
-
7.0%
]
6.87%
1,3824.4%
[
7.0%
-
7.5%
]
7.05%
71,0194.1%
[
7.0%
-
7.5%
]
7.38%
3,1181.2%
[
7.5%
-
8.0%
]
7.58%
7,4291.7%
[
8.5%
-
9.0%
]
8.70%
64,1964.1%
[
8.5%
-
9.0%
]
8.95%
53,3782.7%
[
9.0%
-
9.5%
]
9.20%
9,2029.0%
[
9.5%
-
10.0%
]
9.78%
50,6113.6%
[
11.5%
-
12.0%
]
11.81%
39,1813.1%
[
12.5%
-
13.0%
]
12.70%
1,2994.5%
[
13.0%
-
13.5%
]
13.10%
50410.8%
[
14.5%
-
15.0%
]
14.50%
11,0344.8%
[
14.5%
-
15.0%
]
14.51%
2,9351.3%
[
15.0%
-
15.5%
]
15.35%
27,1394.4%
[
16.5%
-
17.0%
]
16.78%
32,9035.5%
[
22.5%
-
23.0%
]
22.95%
19,6274.3%
[
31.5%
-
32.0%
]
31.74%
8,3942.2%